News articles · Bariloche in data
Fewer children, farther from school
San Carlos de Bariloche now records almost half as many births as thirteen years ago, and it has more schools than in 2011. But the schools stayed in the centre, the city grew outwards, and the municipality expects it to keep growing that way.
The column in brief
The column brings together three things that are rarely looked at side by side: how many children are born, where they live and where the schools are. The conclusion is uncomfortable. Bariloche will have fewer and fewer children, but they will live farther and farther from school. Births have fallen by almost half in thirteen years and the number of schools has grown, but schools remain concentrated in the centre while the city has grown towards its edges. In a long, narrow city with a few avenues that jam at rush hour, that means longer journeys for thousands of children and their families.
The report below sets out the sources (vital statistics, census tracts, the official register of schools, and the municipality's maps and projections), how the measures by neighbourhood and district were built, an original projection of school-age children to 2035, and its limits. The main one: enrolment by school is not yet observed, so the report counts schools, not places. An interactive map at the end lets you explore each neighbourhood.
Technical report
Schools and demography in San Carlos de Bariloche: births, school supply and where school-age children live.
Summary
This report asks whether the supply of schools in San Carlos de Bariloche (Río Negro, Argentina) matches the number and the location of school-age children, today and towards 2035. It combines public sources: births by mother’s residence (RENAPER and the Río Negro Ministry of Health), the 2010 and 2022 censuses by census tract, the official school register 2011–2026, the municipal map of neighbourhoods and districts («delegaciones»), the municipality’s population projection by district, its register of hotel establishments and its map of bus stops.
We document four facts. First, births in the department fell from 2,460 in 2012 to 1,316 in 2025 (−47%), and 2026 data show no rebound. Second, the number of mainstream schools grew by 21% between 2011 and 2026. Third, the city grew outwards: of the 22,300 inhabitants it added between 2010 and 2022, none ended up in the Urbana district (the centre and its surroundings), which lost population and 18% of its children aged 0–17. Schools, however, remain concentrated in the centre: El Cóndor has 811 children aged 6–12 per primary school and Urbana, 164. Fourth, a cohort projection shows that the primary-age population has already peaked and the secondary-age population will peak around 2029. Combined with the municipal projection, the territorial gap widens: without new schools, in 2035 there would be 760 children per primary school in El Cóndor and 101 in Urbana.
The main limitation is that we do not observe enrolment by school: we measure schools, not places.
Question and context
The question has two parts. Is the supply of schools, by level and by area, where children live? And which areas will need more or fewer places in the coming years, given falling births and the uneven growth of the city?
The national context is well known. Births in Argentina have been falling since 2014, with a particularly sharp drop in births to adolescent mothers. A study by Argentinos por la Educación projects a 27% fall in national primary enrolment between 2023 and 2030, and places Río Negro among the provinces with the largest share of small classes by 2030 (Chequeado, 28/01/2026). In the city of Buenos Aires, first-grade entrants to public schools fell by about 25% between 2020 and 2025, and the city government began closing classes (Infobae, 15/10/2025).
What these studies do not show is the territorial dimension within a city. In cities that grow at the edges, an aggregate fall in demand can coexist with shortages in new neighbourhoods. In Bariloche this meets a mobility problem: the city is long and narrow, with few trunk roads that jam at rush hour (ANBariloche, 12/7/2024). Distance to school matters in itself. In Norway, each additional half hour of travel to the nearest upper-secondary school lowers the probability of on-time graduation by about 2.3 percentage points, with larger effects among average students (Falch, Lujala and Strøm, 2013). In Baltimore, a Johns Hopkins University study associated each additional ten minutes of public-transit commute with a third of a day more of absence per year in high school (K-12 Dive, 20/3/2019).
Data
Births
We use two sources of births by mother’s residence, at the department level:
- RENAPER, «Births by department and year 2012–2022» (datos.gob.ar).
- Río Negro Ministry of Health, Provincial Statistics Office, Vital Statistics yearbooks 2020 and 2022–2025 (the 2021 yearbook is a scanned image). Table 2 gives live births by department of residence; another table gives them by health area («Área Programa»), which for Bariloche roughly corresponds to the city.
In the years they overlap, the two sources differ little for the department: in 2020 RENAPER records 1,670 and the Ministry 1,650 (−1.2%); in 2022, 1,539 and 1,567 (+1.8%). For the province the gap is larger (−6.7% in 2020 and +3.0% in 2022). The series uses RENAPER up to 2022 and the Ministry from 2023, without adjustment.
Bariloche department also includes El Bolsón, Dina Huapi and other towns. There is no long series of births by town of residence. For 2026 there are only Civil Registry press releases with births registered by place of registration, which are not comparable with births by residence.
Population by age and area
The 2010 and 2022 censuses by census tract come from INDEC’s processing published with CONICET’s cartography (Rodríguez and de Grande) on source.coop. We keep the tracts within the municipal boundary. Three corrections:
- The 2010 census was de facto and the 2022 census de jure. In 2010 people were counted where they spent the night of 27 October, in the middle of the school-trip season. In six central tracts, hundreds of 17- and 18-year-olds staying in hotels appear. We correct ages 16–19 in those tracts.
- 2010 ages come from the long-form sample. We expand them to each tract’s total population. Tracts without age data are imputed with the city’s age structure.
- The 1991 census uses a different province coding by variable. For 1991 we only use total population by tract.
From the 2022 census we also use dwelling occupancy (people present or not) and the reason for absence.
Schools
The official school register of the Ministry of Human Capital (2011–2026 editions) identifies each service unit by its CUE code and annex, with level, sector and address. We keep mainstream education (kindergarten, primary and secondary). We filter by a list of localities within the municipal boundary, because the register records Colonia Suiza, Península San Pedro or Villa Los Coihues separately.
In 2026 there are 123 mainstream units, 115 of them with kindergarten, primary or secondary (69 public, 43 private and 11 community or cooperative, counting all levels). One institution can register several levels under different codes: private schools often register kindergarten and primary under one CUE and secondary under another, and public buildings often host a kindergarten and a primary school. We group units less than 20 metres apart: the 115 units with a mainstream level are 103 institutions in 90 buildings. On the map, each dot is a building with all the levels taught there. Counts by level barely change with this grouping, so ratios of children per school use units.
Cartography, projection, hotels and buses
Neighbourhood (140) and district polygons come from the Municipality’s zoning map. The population projection by district 1991–2035 comes from the «Population projection» dashboard the Municipality publishes on Tableau Public; the method is not documented. Hotel beds come from the «Map of hotel establishments in the city» dashboard (published in 2022, with coordinates and beds of each registered establishment). Urban bus stops (526) come from the municipal map of the urban passenger transport system (November 2026).
Methods
Locating schools
Register addresses are free text. We geocode them with the national Georef API and accept only house-number or intersection matches. When the address failed, we matched by name with the Municipality’s map of schools, and located the remaining 12 by hand with OpenStreetMap, Georef and the municipal map. This locates all 115 units with kindergarten, primary or secondary.
From census tracts to neighbourhoods and districts
We allocate each tract’s population to neighbourhoods in proportion to the share of its area in each (areal interpolation). This assumes even population within each tract; at the edges tracts are large and the assumption matters more. Municipal neighbourhoods do not cover the whole municipal area. For districts, interpolated totals almost match the municipality’s, but the split does not: Urbana is larger according to the municipality and Pampa de Huenuleo smaller. We use municipal growth (not levels) for projections.
Decomposing the change in children by district
To separate how much of the change in children aged 0–17 in each district between 2010 and 2022 is due to population change and how much to a change in the share of children, we use the standard decomposition: Δchildren = (P₂₀₂₂ − P₂₀₁₀) × s₂₀₁₀ + P₂₀₂₂ × (s₂₀₂₂ − s₂₀₁₀), where P is population and s the share of children. The first term is the population effect and the second the share effect. Census tract data cannot distinguish moves within the city from arrivals from elsewhere.
School-age children, 2001–2022
Cohort interpolation between censuses. To give the projection a history, we rebuild the number of children aged 3–17 in the city year by year between the 2001, 2010 and 2022 censuses. Each cohort (year of birth) is observed in two consecutive censuses; in between, whatever it gained or lost (moves, mortality) is spread linearly, so the series matches all three censuses exactly. A cohort born after a census takes the value of the next census. Census dates (November 2001, October 2010, May 2022) are treated as mid-year, and 2010 uses the expanded sample corrected for school trips (previous section). Result: primary-age children numbered 14,000 in 2001, 11,400 in 2010 and 14,400 in 2022; the secondary-age population bottomed out around 2017 (8,100). Code: analisis.py historia → datos_intermedios/chicos_ciudad_historia_2001_2022.csv.
Projecting school-age children
City, by cohorts (2022–2040). Each single year of age in the 2022 census within the city ages one year per year, with no migration or mortality. Cohorts born from 2023 enter with the department’s births multiplied by the ratio between children living in the city and the department’s births in their years of birth (average of ages 0–9 in 2022: 0.84). From 2026 we assume births equal to 2025, consistent with 2026 Civil Registry data. As a sensitivity check, a variant extends the 2022–2025 decline (−5.1% per year): the population aged 6–12 in 2035 would then be 49% lower than in 2022, instead of 45%. Secondary-age population in 2035 does not change, because those cohorts are already born.
Districts (2035). For each district d and age group g: children₍d,g,2035₎ = children₍d,g,2022₎ × (P₍d,2035₎ / P₍d,2022₎) × r₍g₎, where P is the municipal projection and r₍g₎ the ratio between children in group g in 2035 and in 2022 in the city cohort projection. It assumes that newcomers to each area have the same age structure as current residents, adjusted for current fertility. It is a scenario, not a forecast: if new neighbourhoods mainly attract young families, it underestimates children at the edges.
Other indicators
- Children per school: children of the level’s age (3–5, 6–12, 13–17) over units of that level within the area. Río Negro has seven years of primary and five of secondary.
- Next cohort: children aged 0–4 over children aged 5–9 in 2022.
- Distance: straight line from each tract’s centre to the nearest school of the level, weighted by the tract’s children. It ignores slopes, streets and transport.
- Distance to the bus stop: from each tract’s centre to the nearest stop.
- Hotel beds by district: registered establishments located within each district.
Results
Births fell by almost half
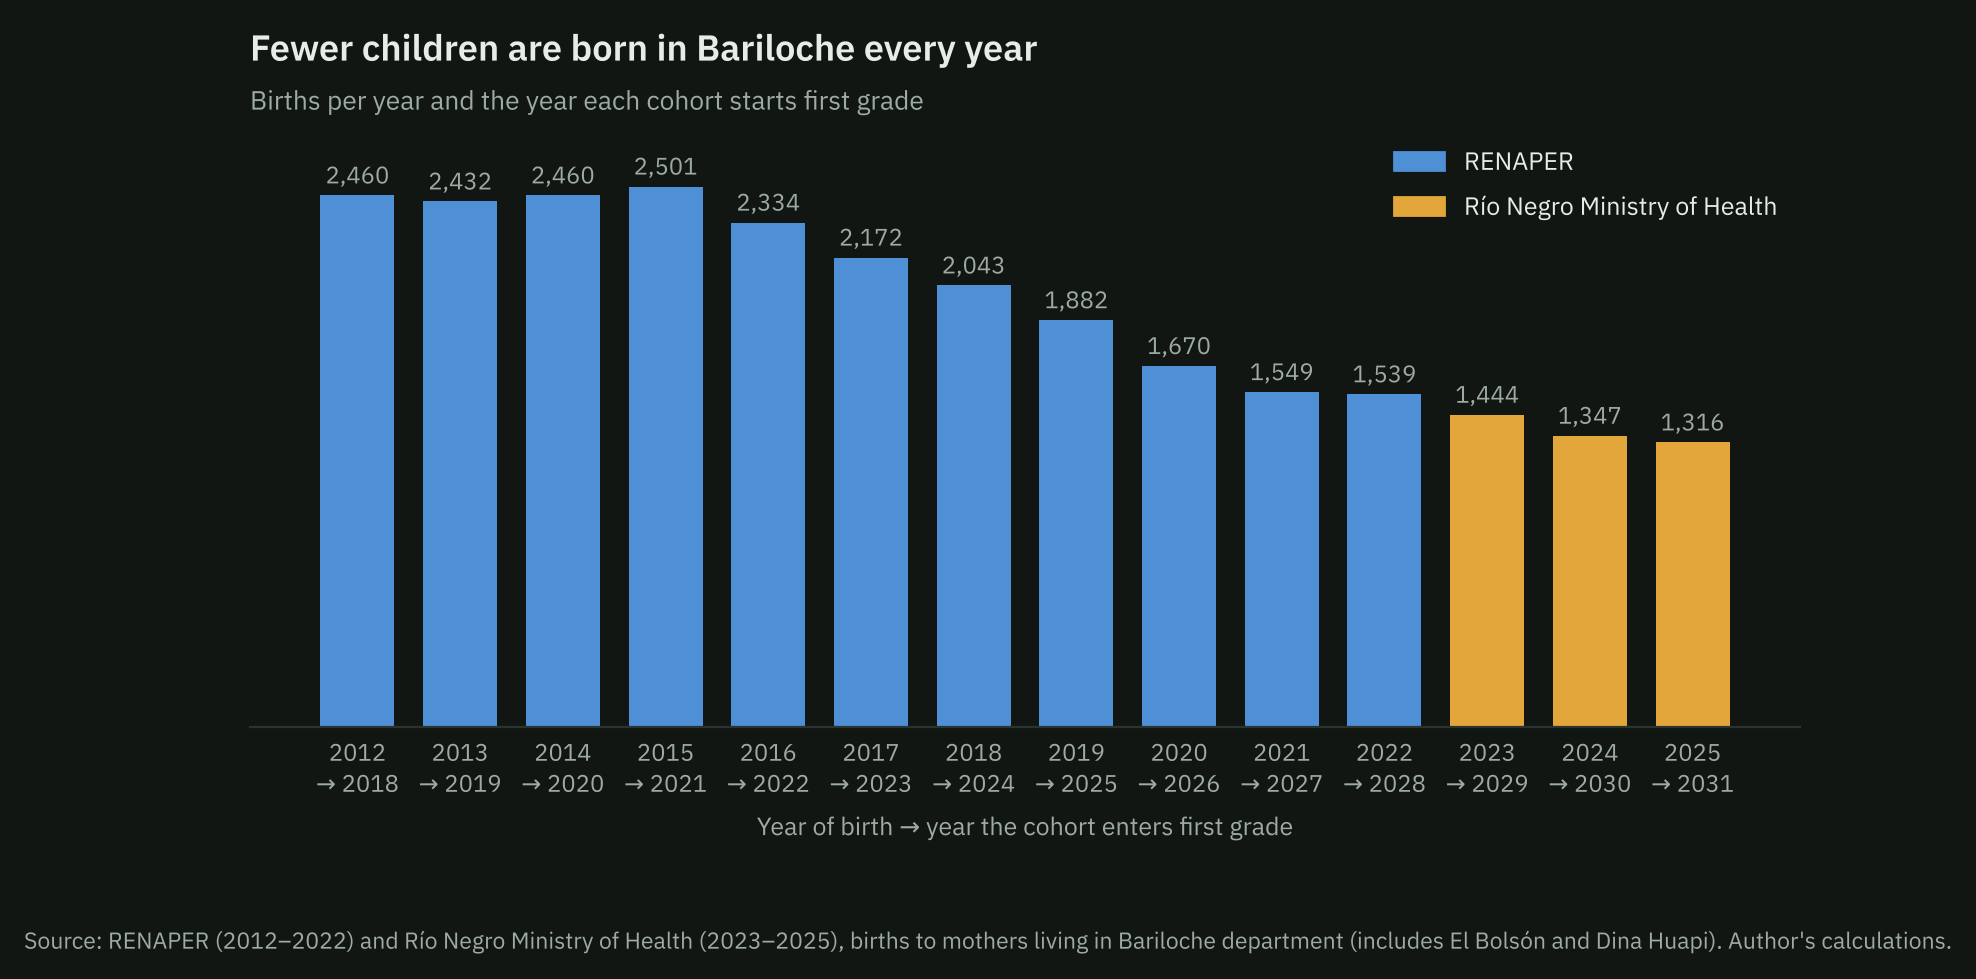
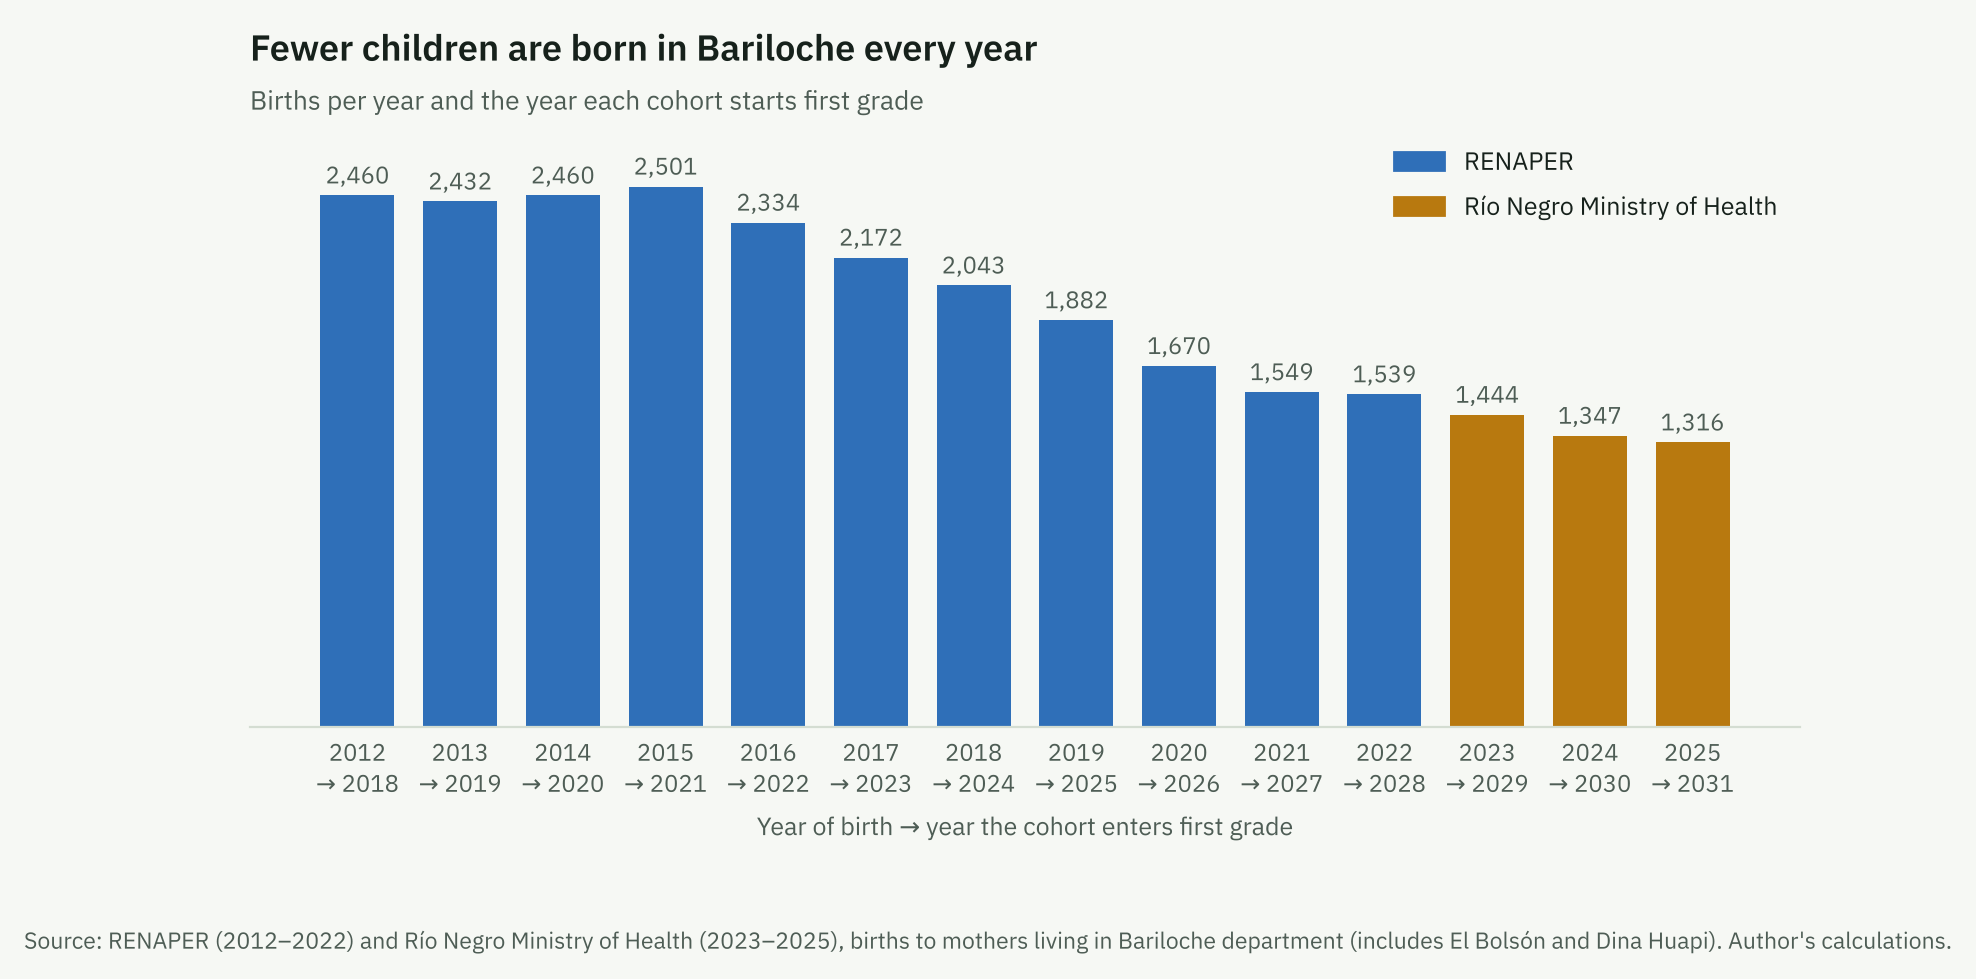
Births in the department were stable until 2015 and have fallen every year since. In 2025 there were 1,316, 47% fewer than in 2012. Between 2012 and 2022 the fall was 37%, the same as in Río Negro (38%) and in Argentina (38%). In the Bariloche health area, which approximates the city, births fell from 1,321 in 2022 to 1,097 in 2025. Civil Registry press releases suggest the decline stopped in 2026: between January and September 4,798 births were registered in the province, against 4,834 in the same period of 2025.
Children of each age living in the city equal between 0.79 and 0.88 births in the department in their years of birth, 84% on average. That the ratio is even across ages indicates that the city is a stable share of the department in every cohort.
Supply grew at every level
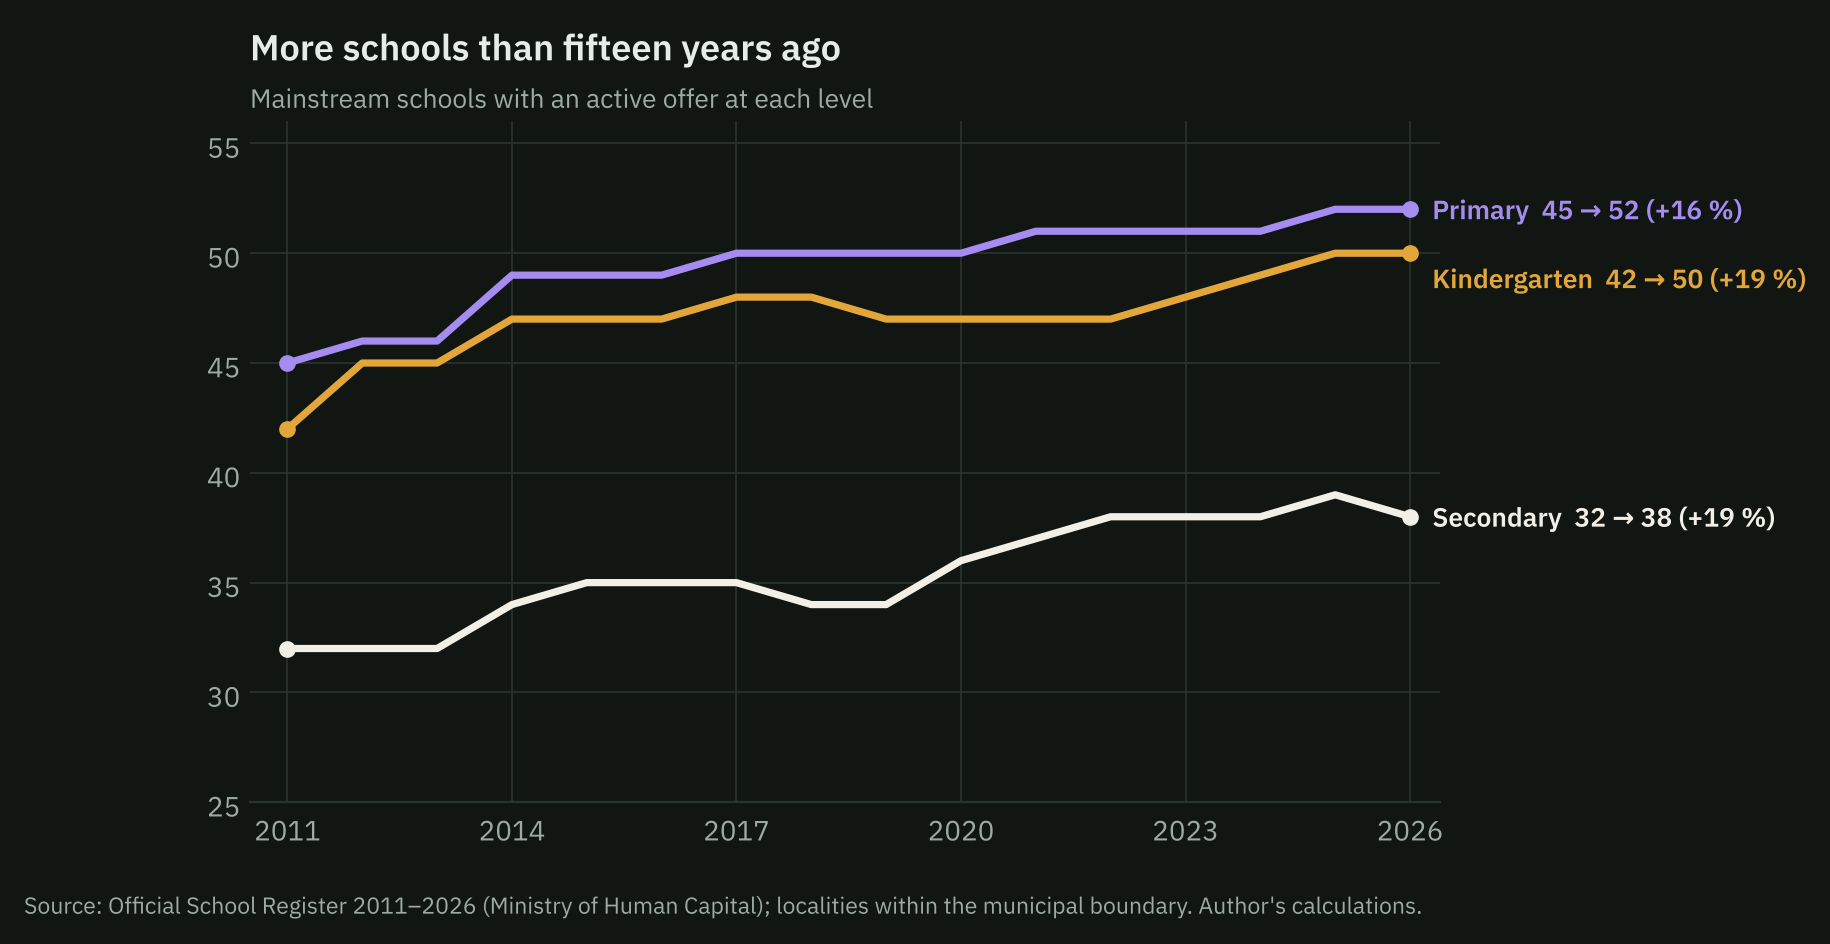
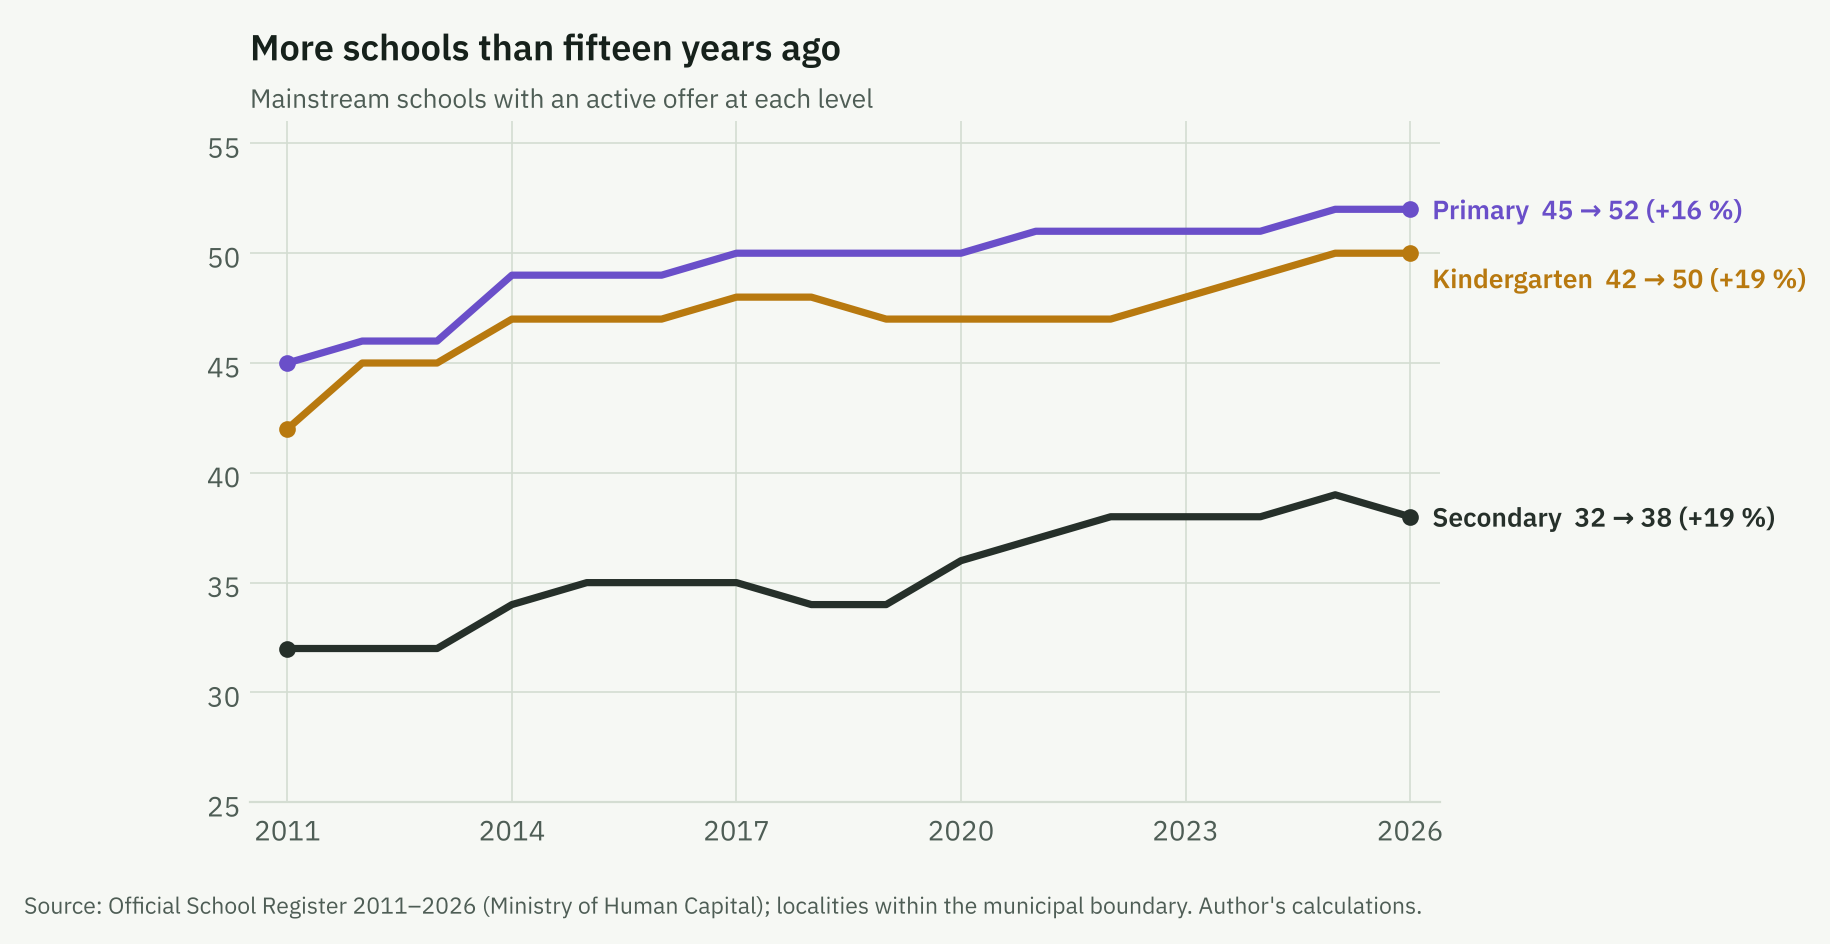
Between 2011 and 2026, kindergartens went from 42 to 50 (19%), primary schools from 45 to 52 (16%) and secondary schools from 32 to 38 (19%). In 2012 the register started to record the community/cooperative sector separately, so series by sector have a break that year.
Primary has passed its peak; secondary will reach it around 2029
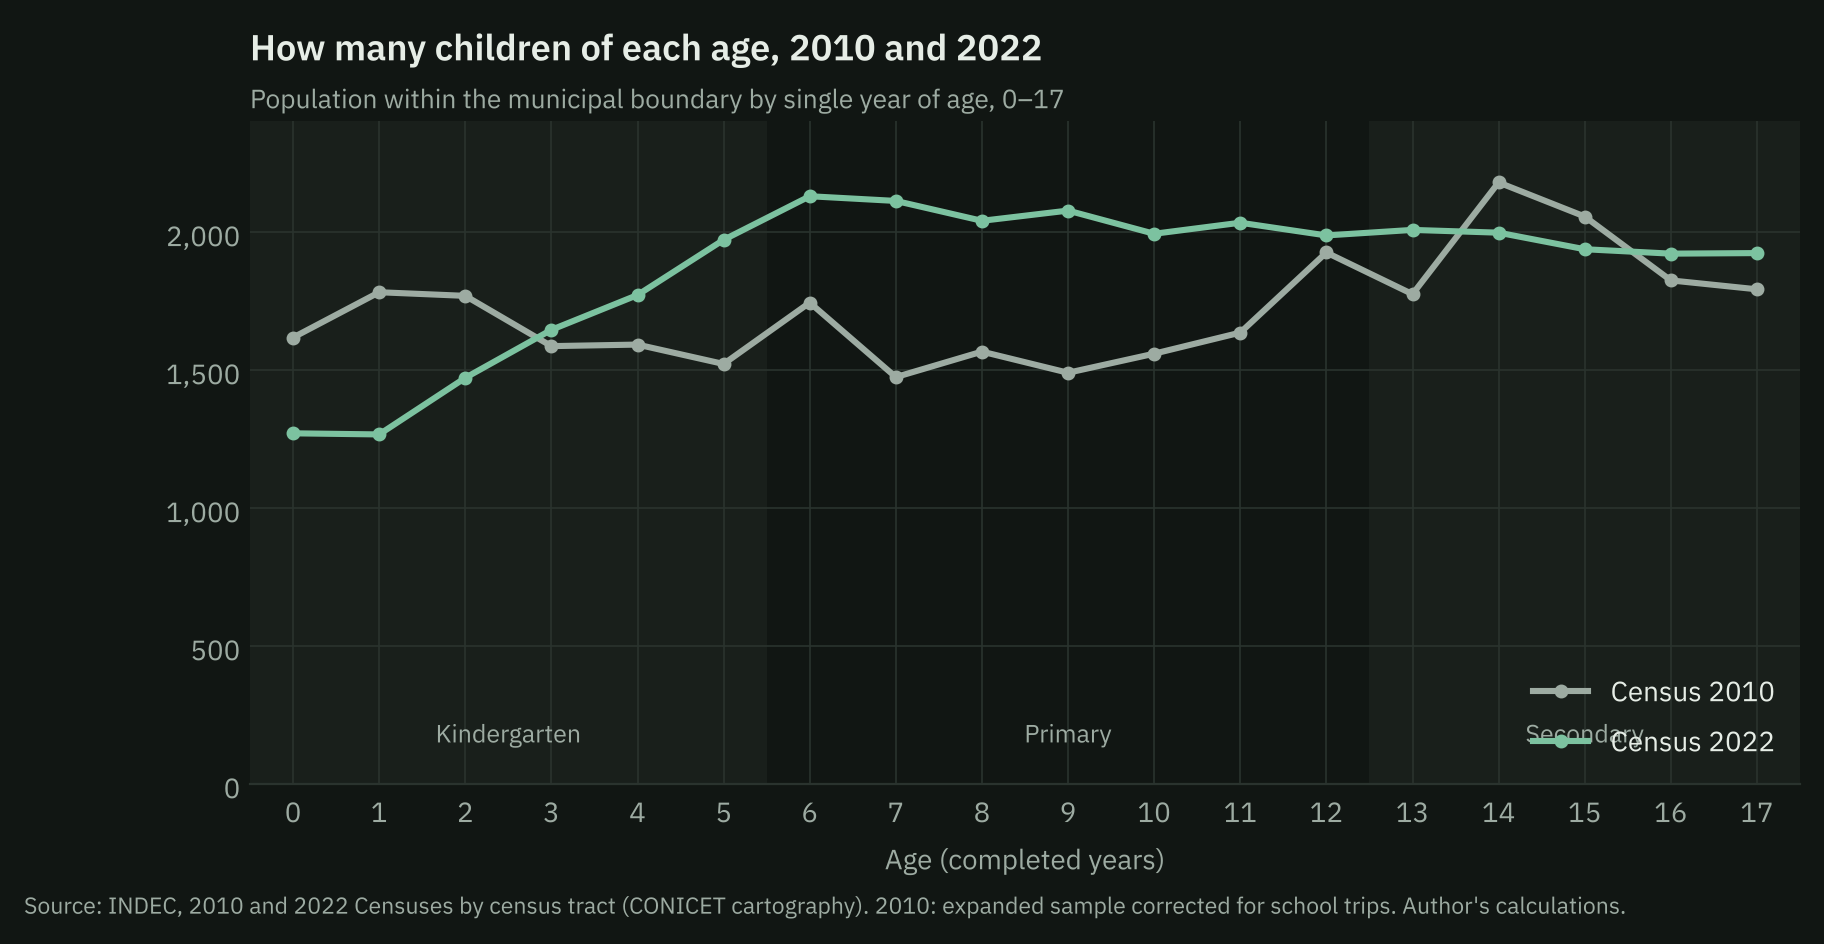
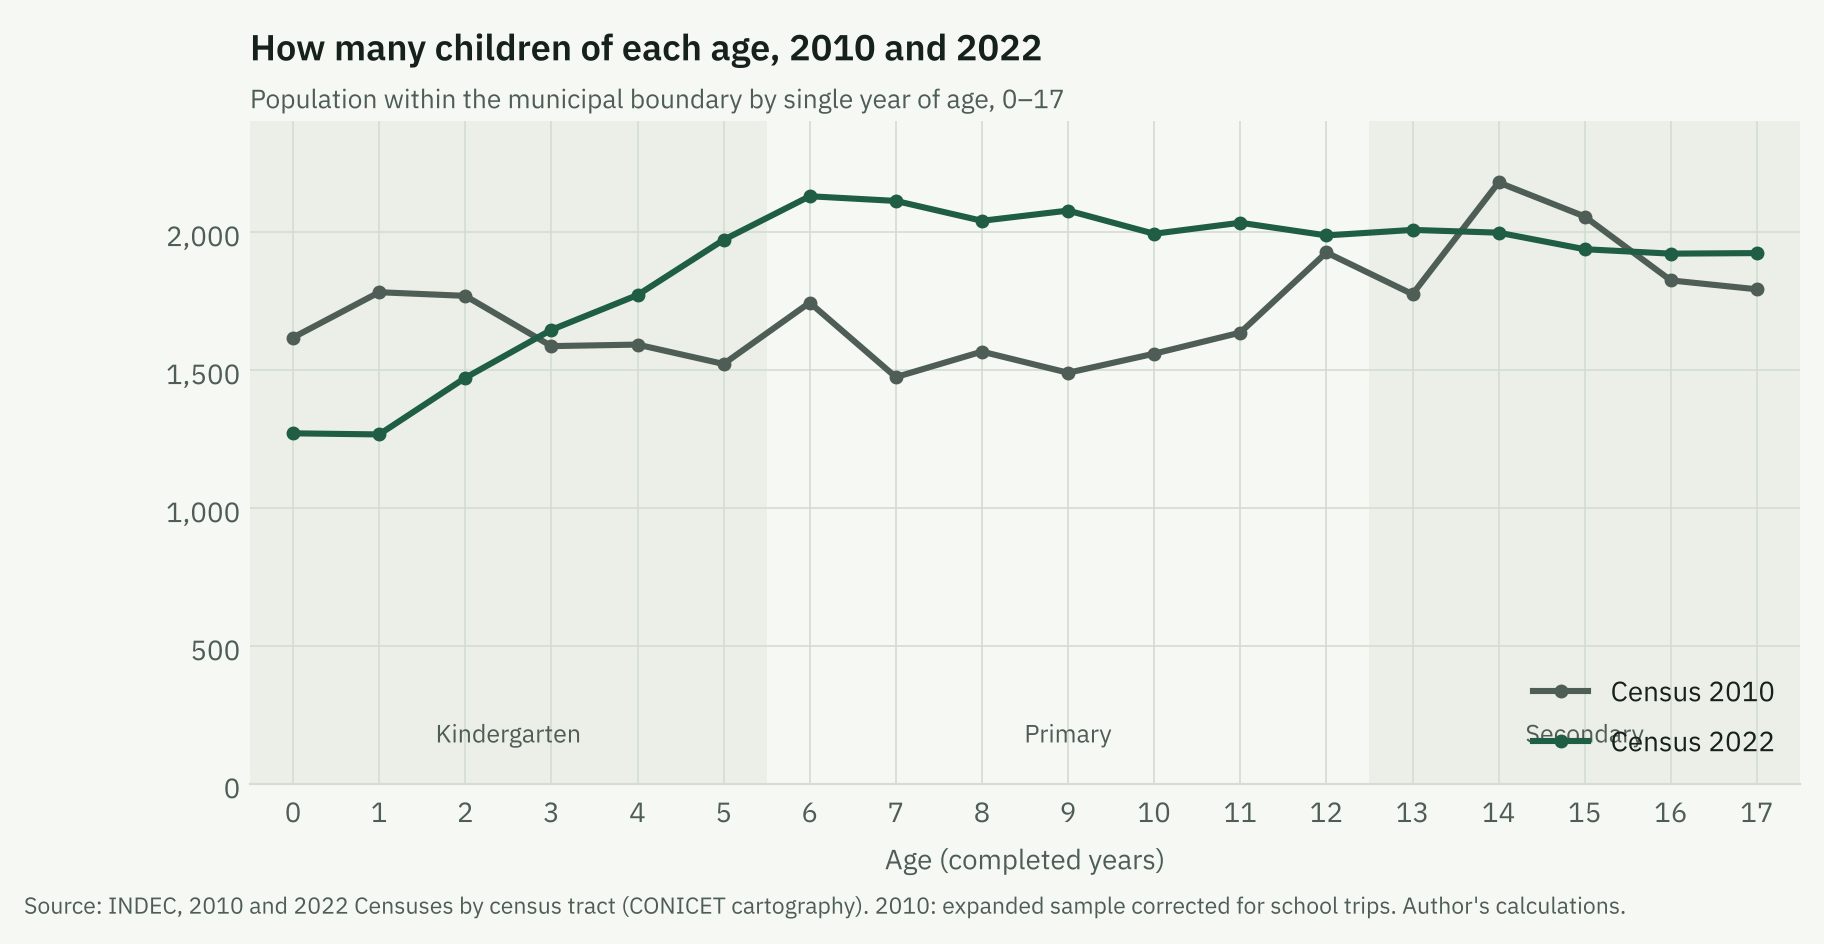
Because the large cohorts were born between 2012 and 2015, the primary-age population grew between censuses: children aged 6–12 in the city went from 11,391 to 14,371 (+26%), while those aged 0–5 were already falling (−5%).
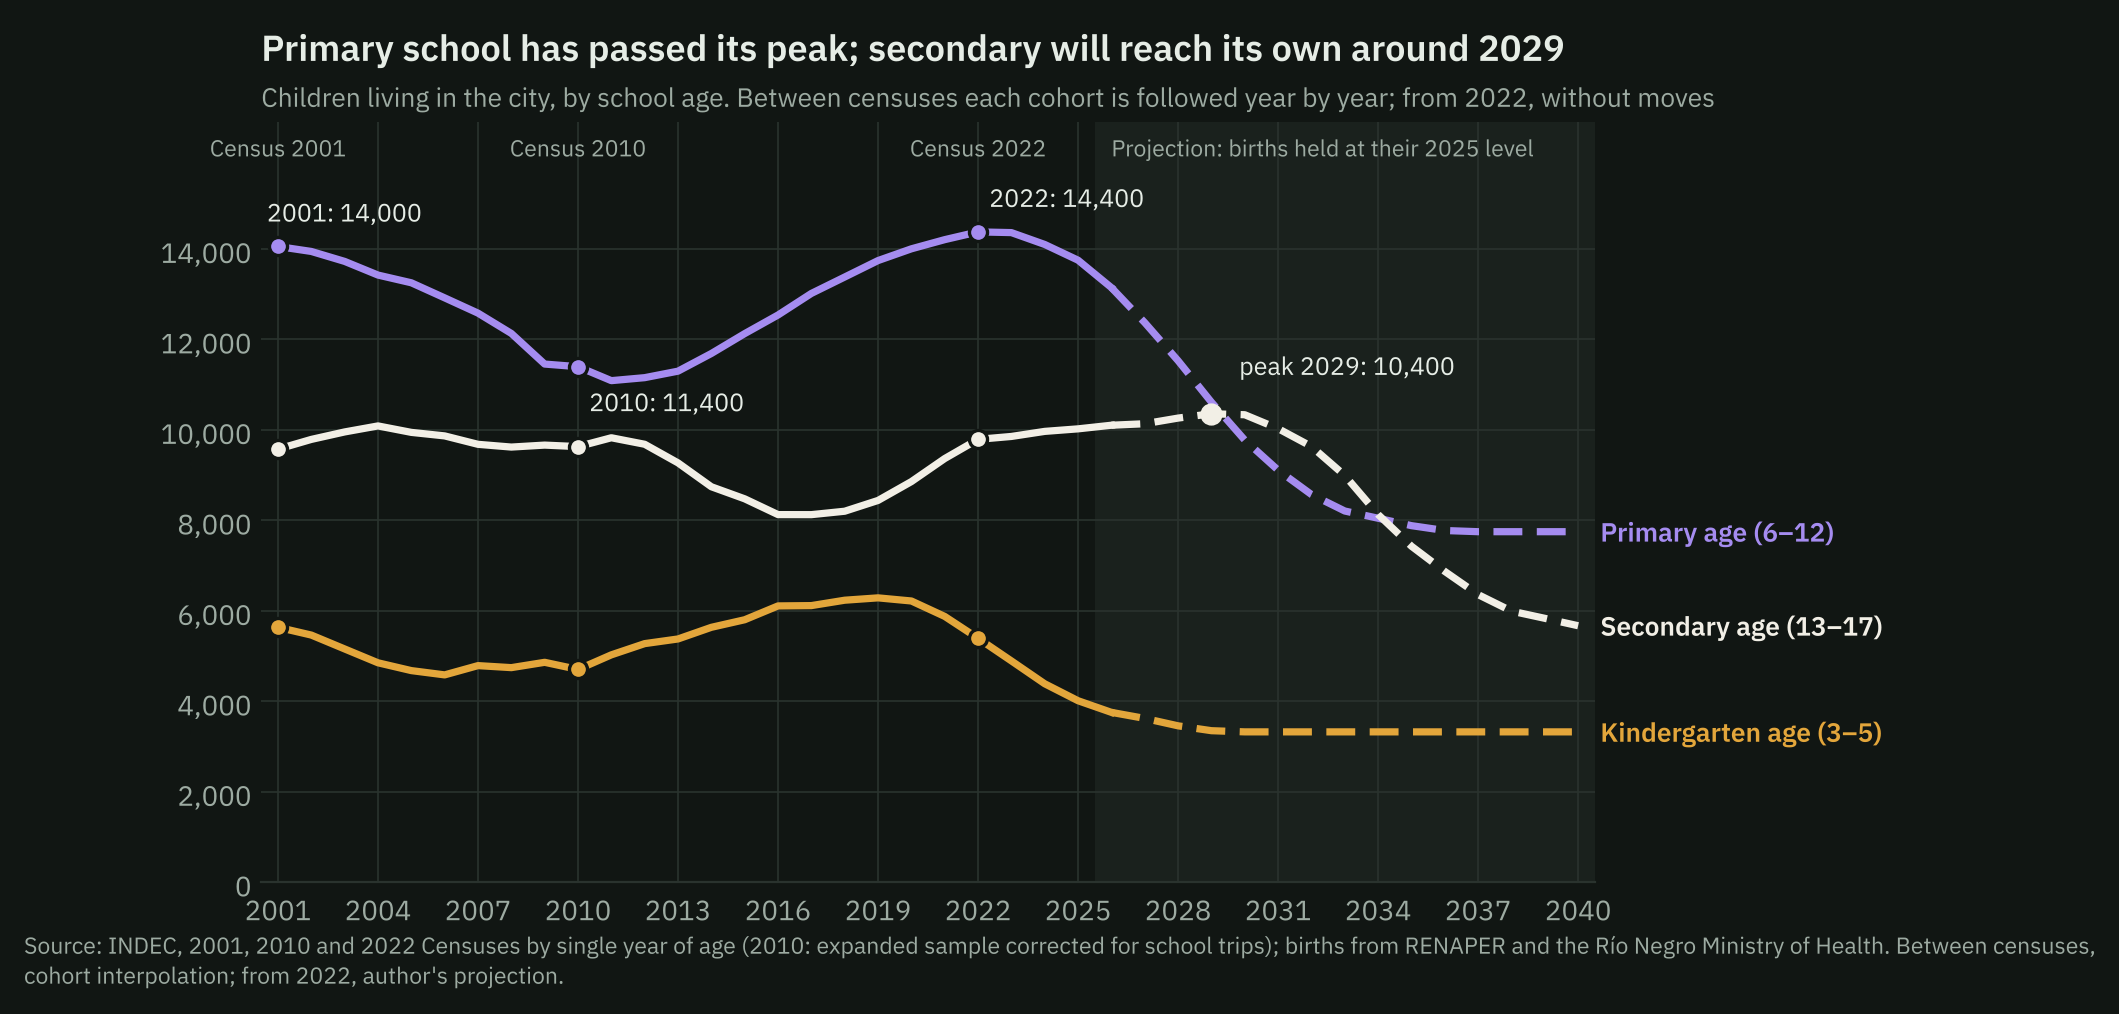
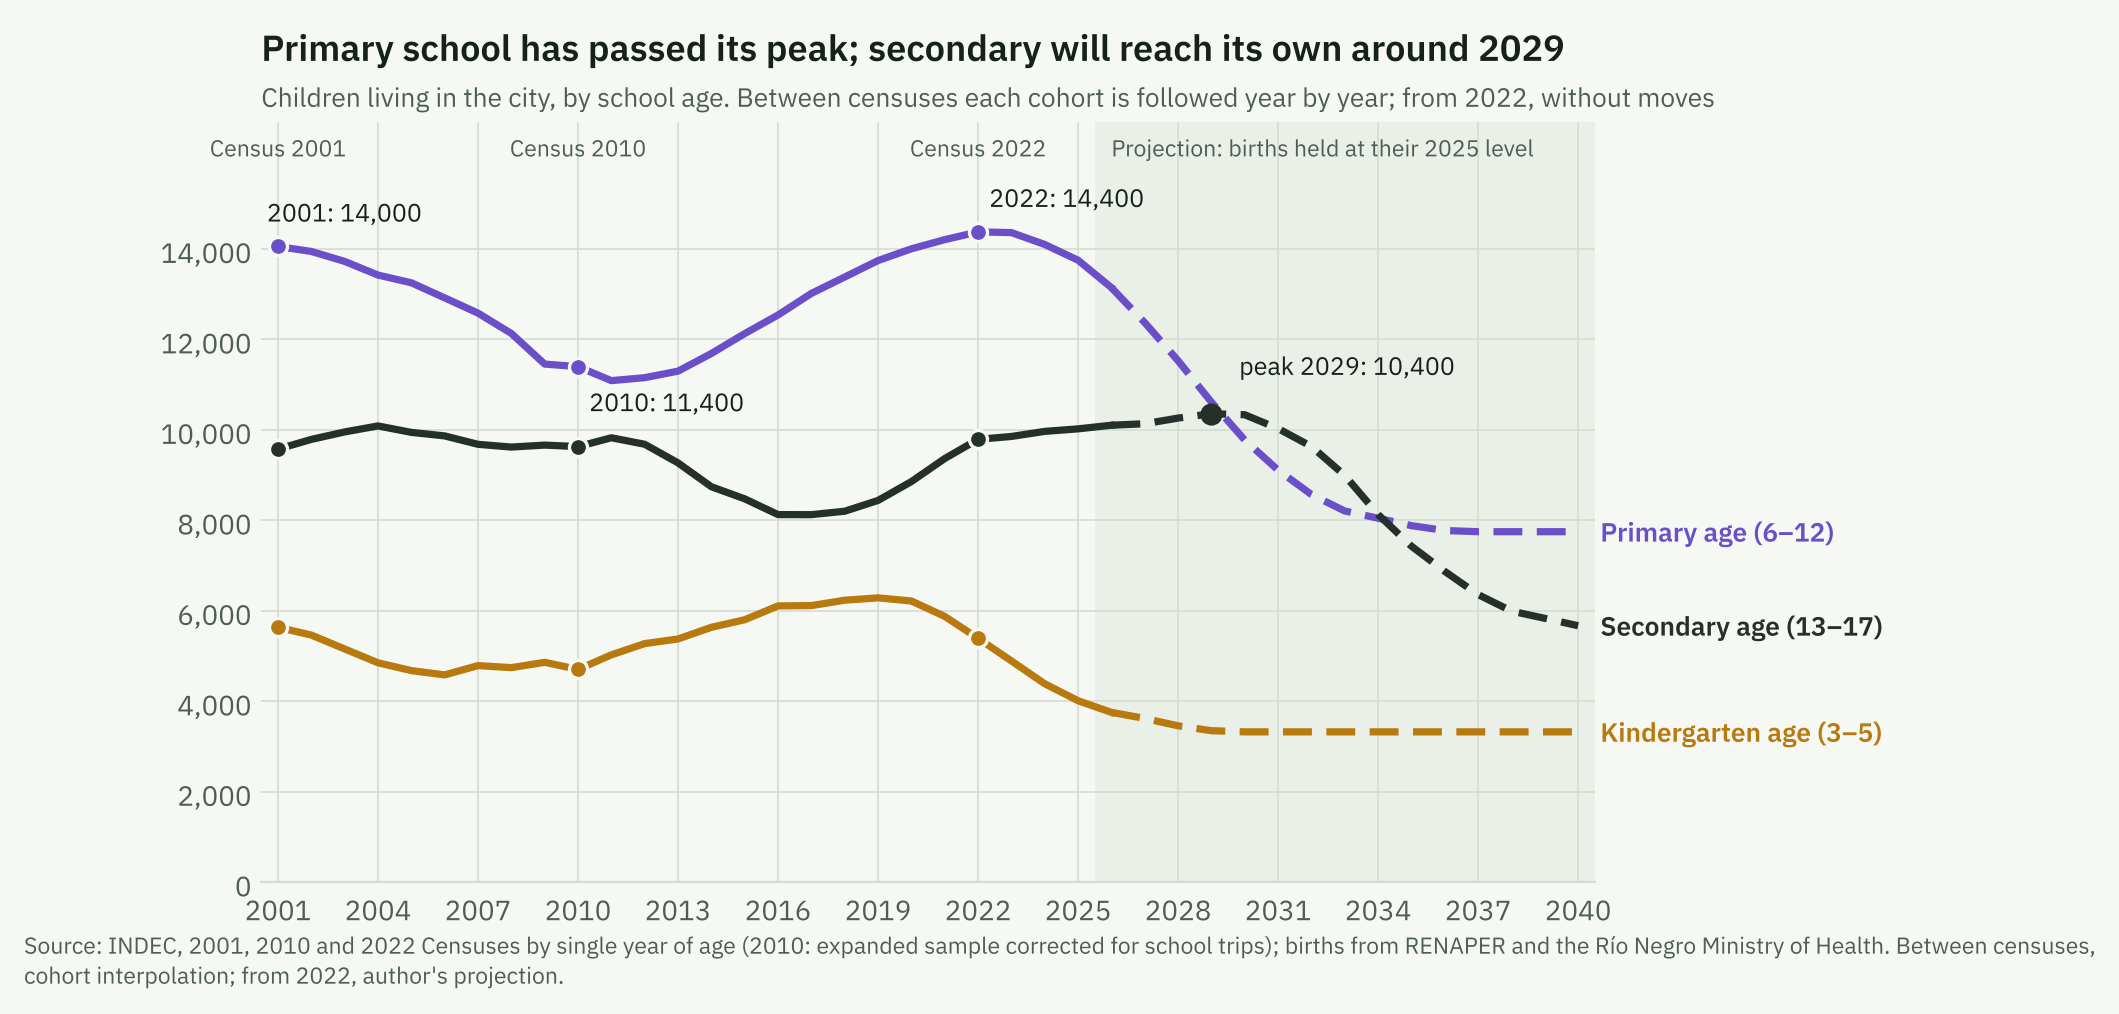
The cohort projection indicates that the population aged 6–12 peaked around 2022 and has been falling since: about 9,800 in 2030 (32% fewer than in 2022) and about 7,900 in 2035 (45% fewer). The population aged 13–17 keeps growing until 2029, reaching about 10,400 (6% more than in 2022), and then falls by 28% until 2035. The largest cohort enters the first year of secondary in 2028. The cohort entering first grade in 2026 is 32% smaller than in 2018, and the 2031 one will be 47% smaller.
The city grew outwards; the centre lost children
The six municipal districts («delegaciones») do not always match the names people use: Urbana is downtown and the surrounding neighbourhoods; Cerro Otto, the inner «kilómetros» along Bustillo and Pioneros avenues plus Lago Gutiérrez; Lago Moreno, the outer kilómetros up to Llao Llao and Colonia Suiza; Cerro Catedral, Villa Los Coihues and the ski base; Pampa de Huenuleo, much of El Alto (the upper southern neighbourhoods); El Cóndor, the east of the city.
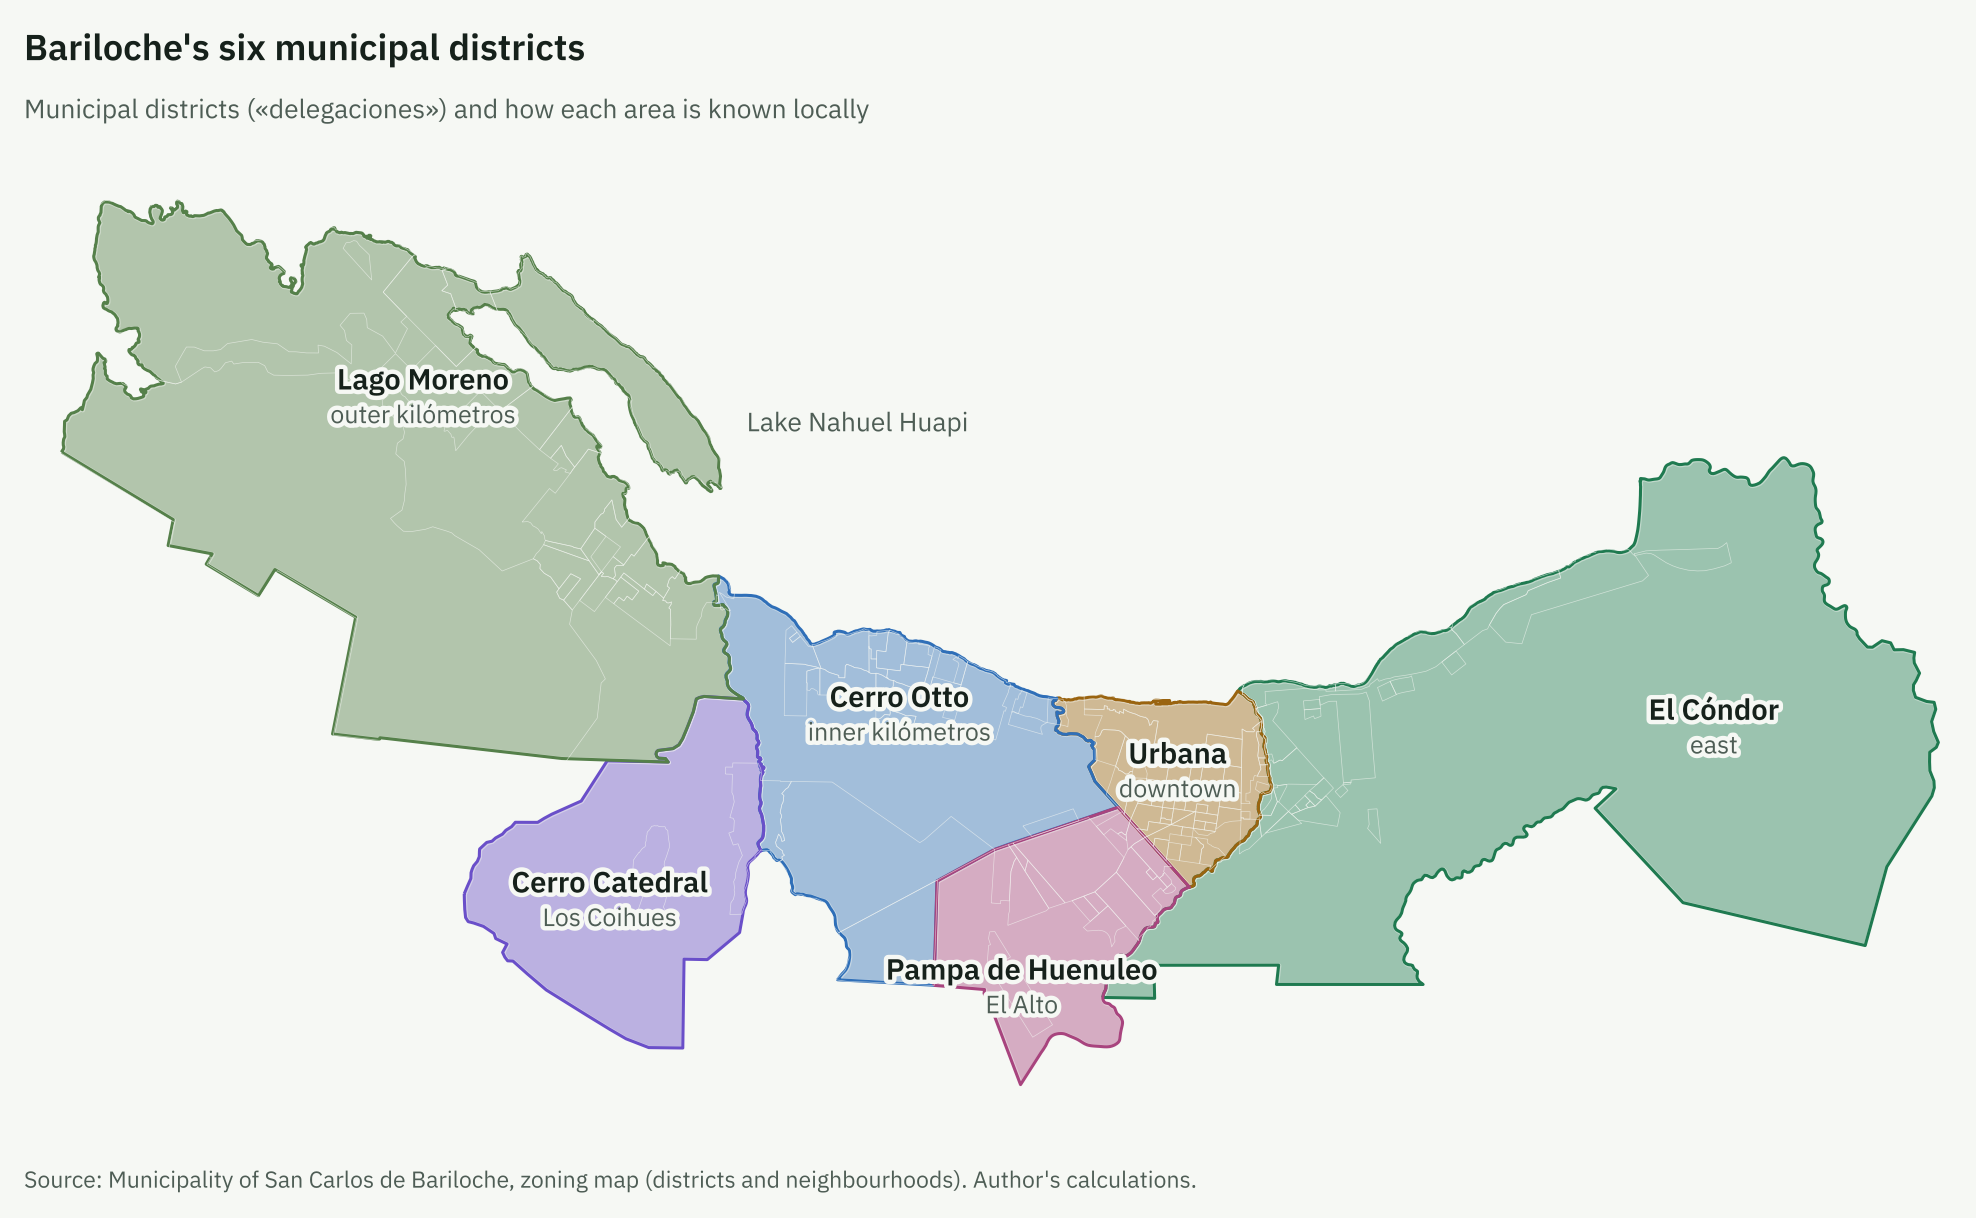
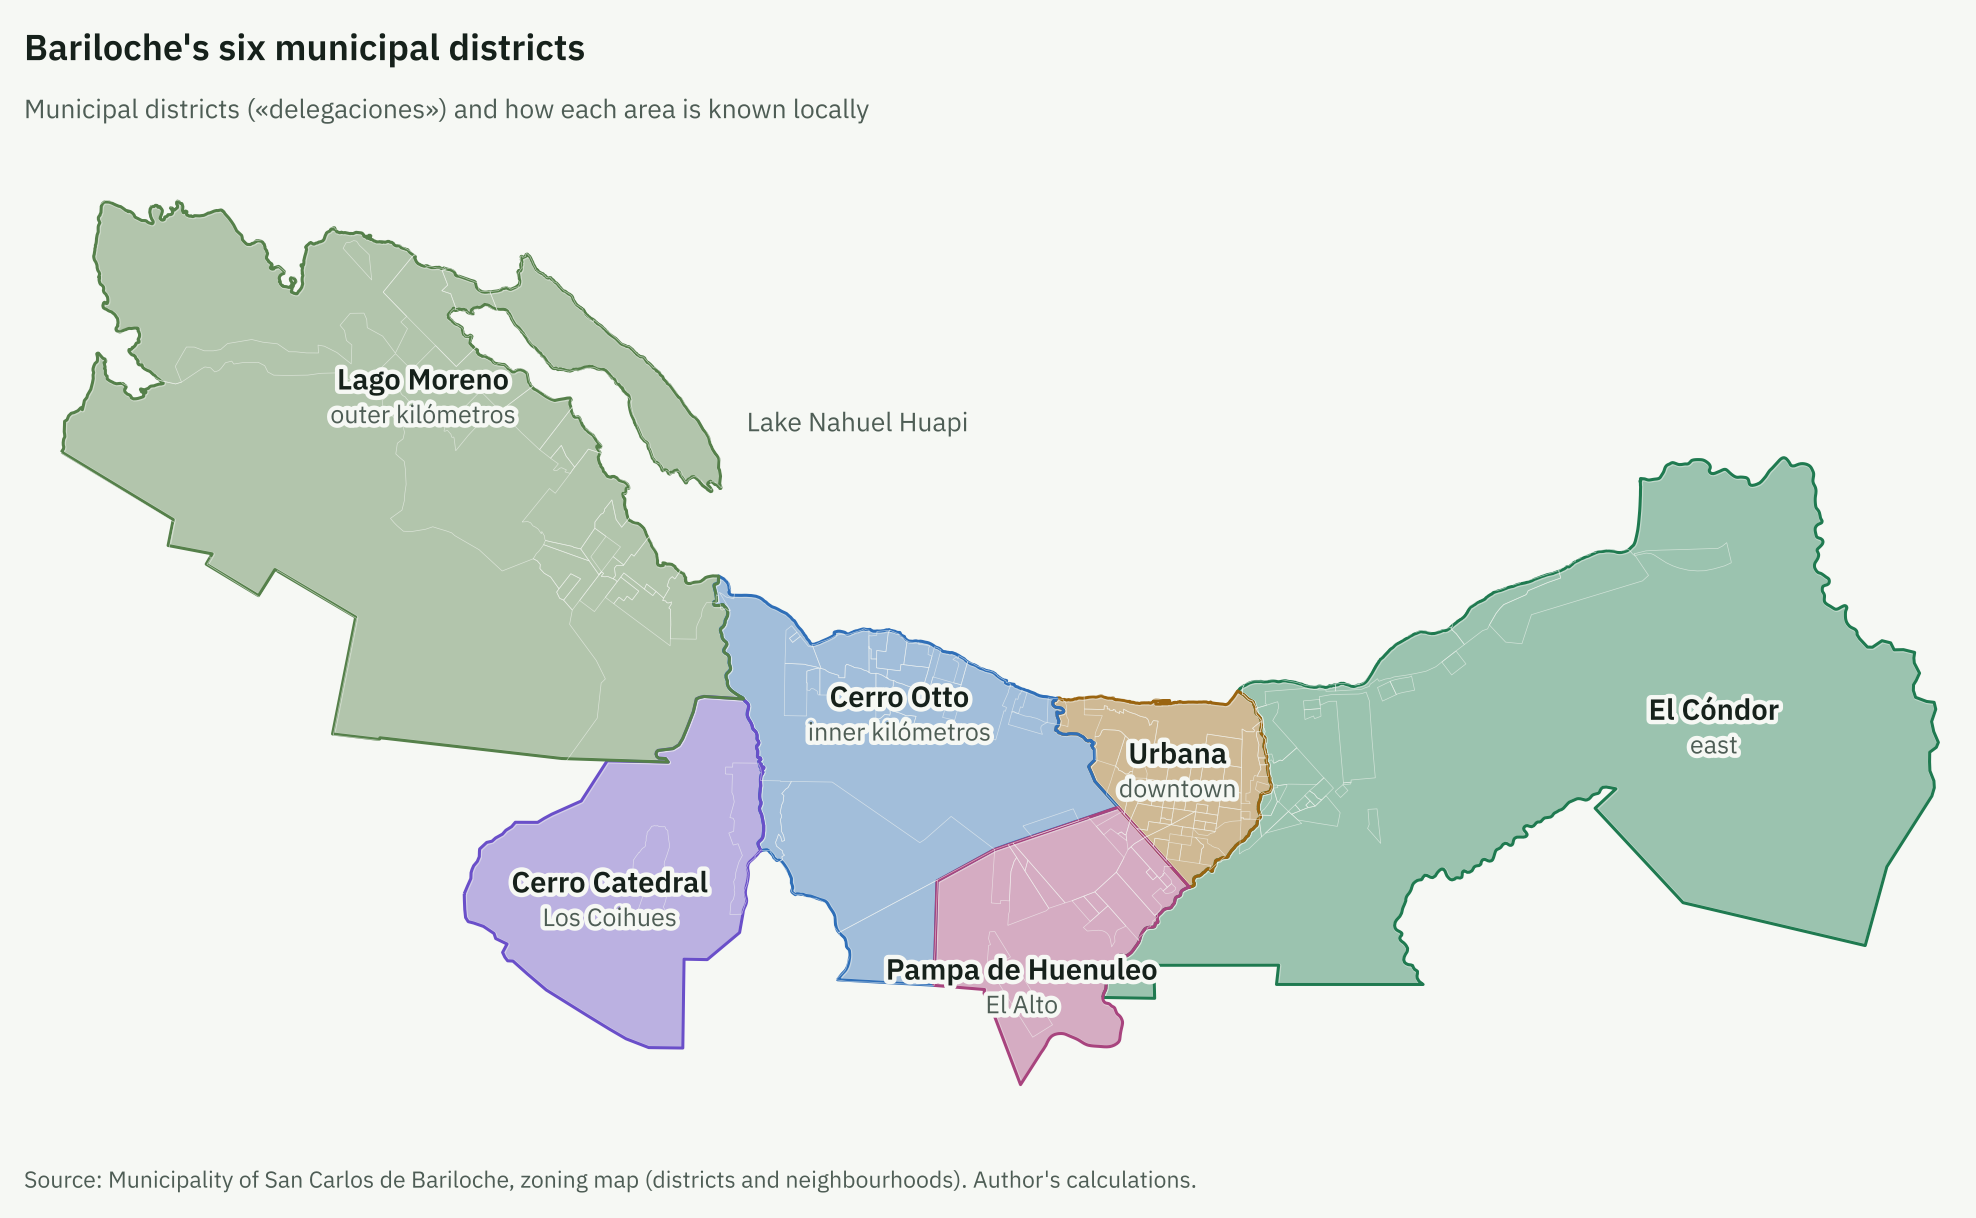
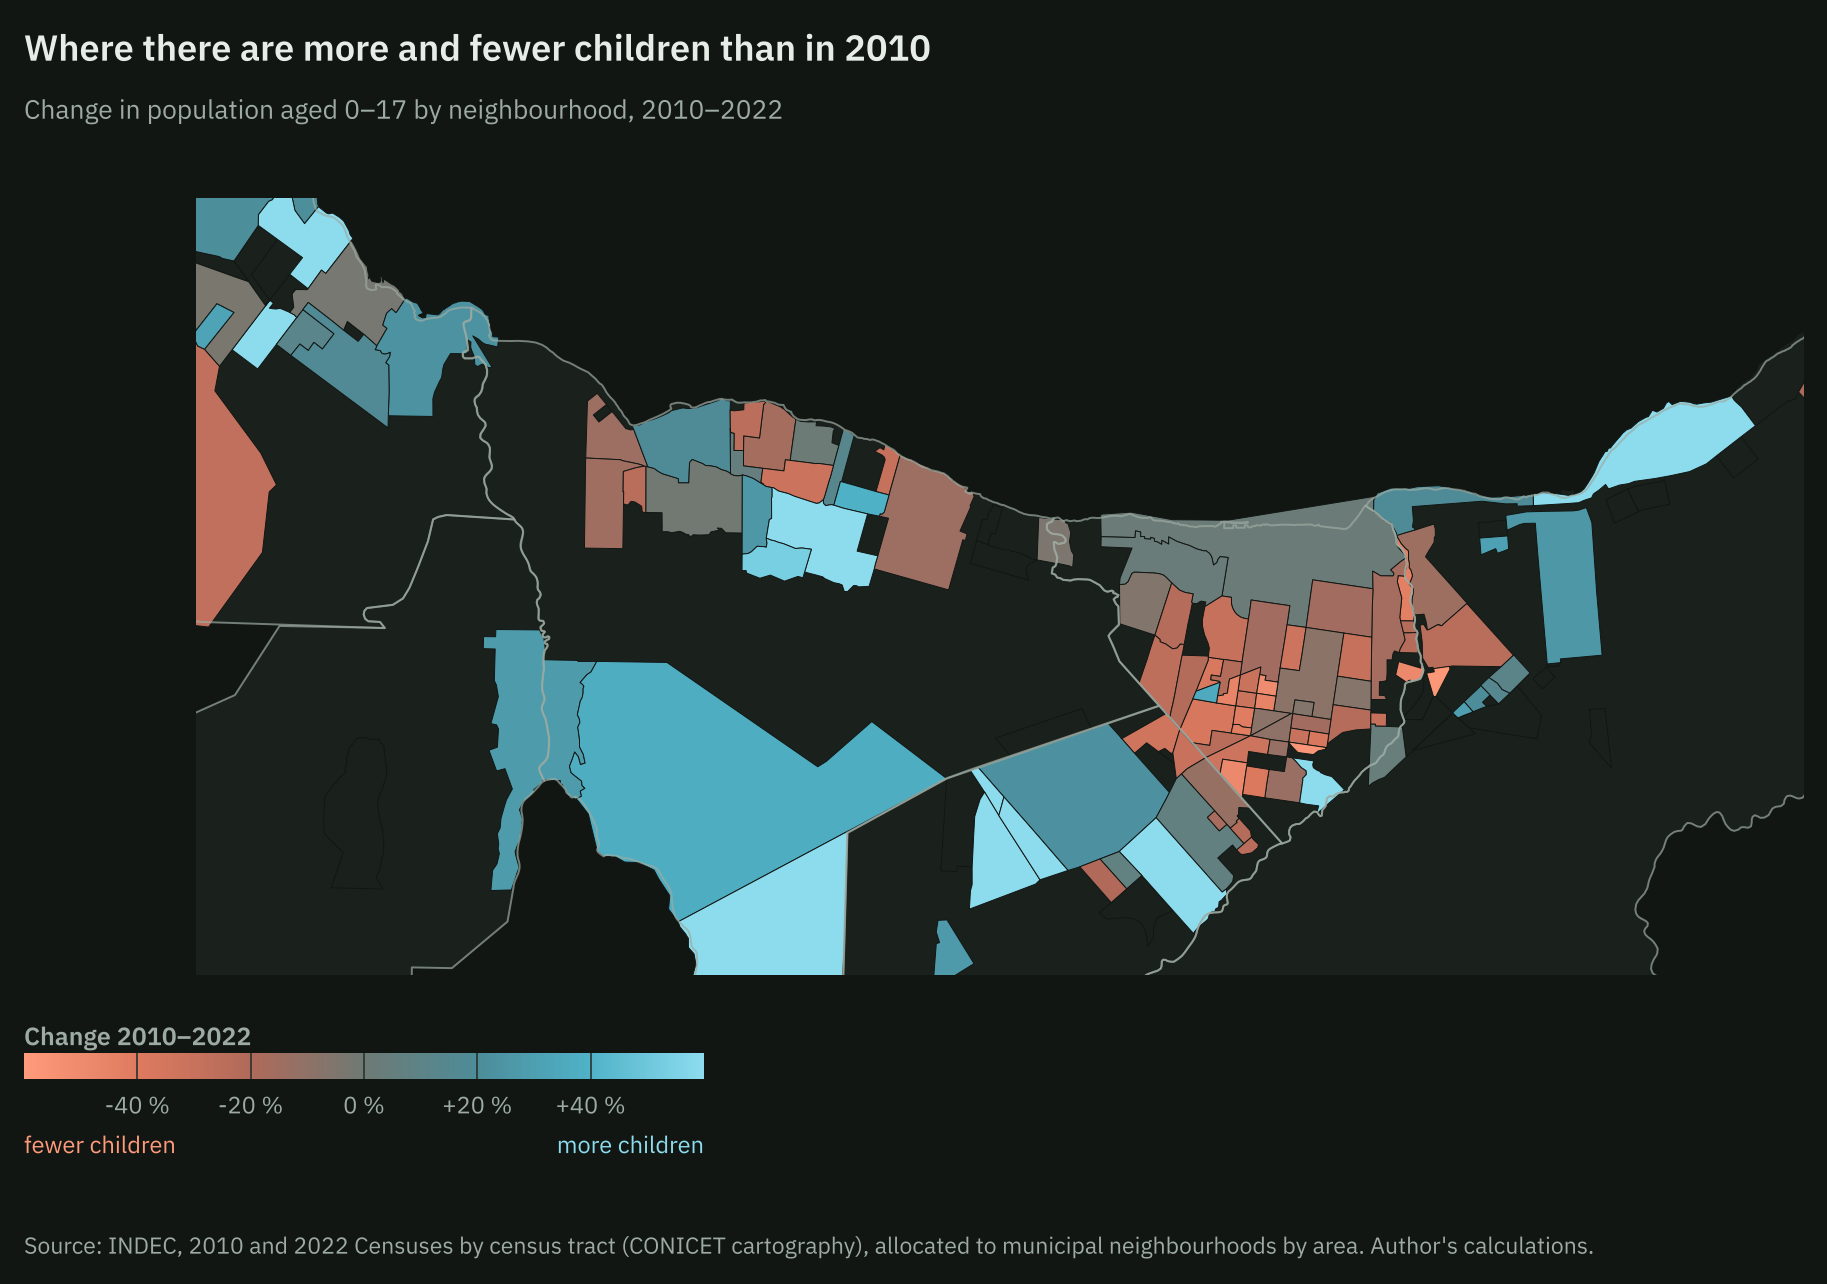
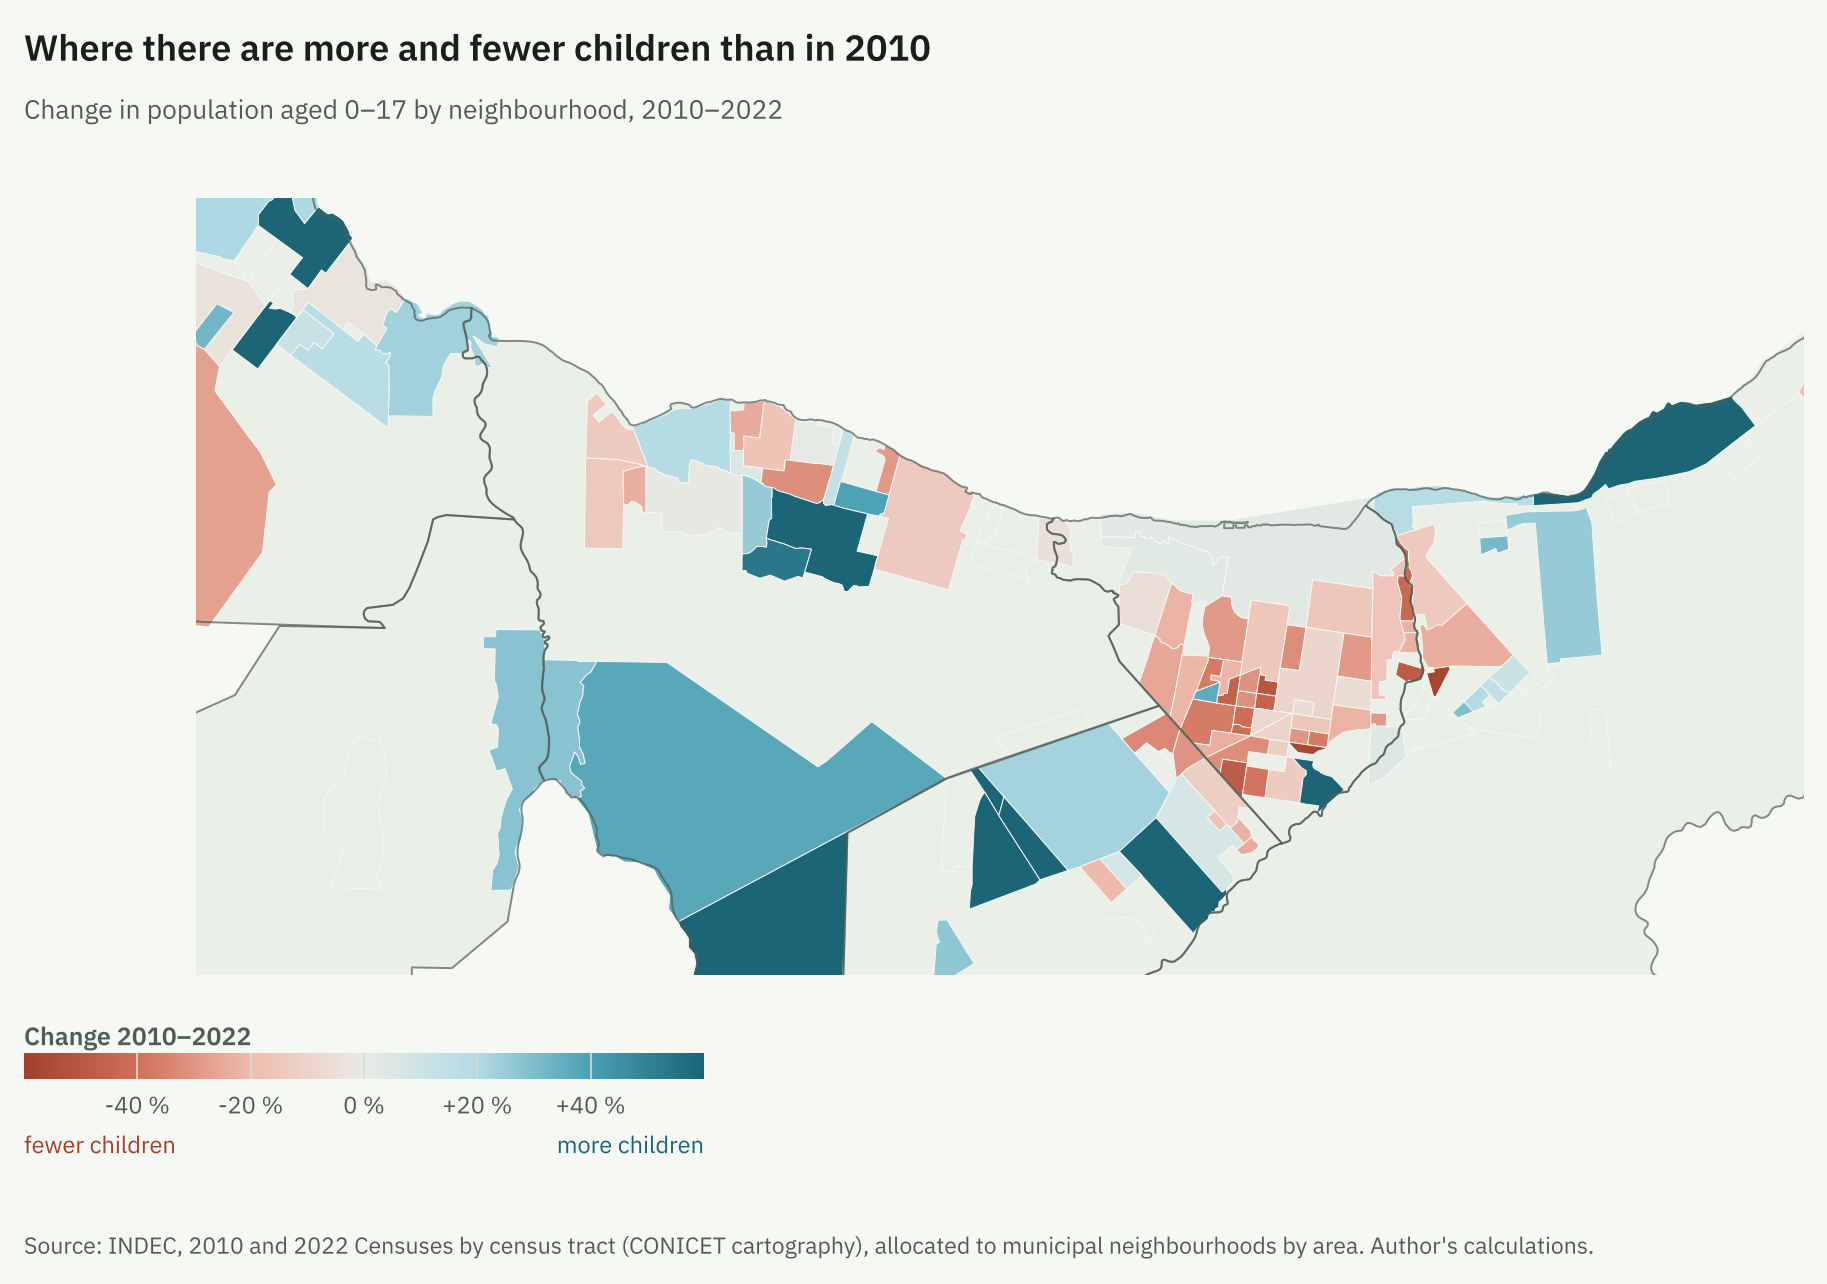
Between 2010 and 2022 the city’s population grew by 20% (about 22,300 people), but the Urbana district lost 4% (from about 55,500 to 53,200). Growth was concentrated in El Cóndor (+77%) and Pampa de Huenuleo (+50%).
The decomposition shows two different mechanisms. In Urbana, children aged 0–17 fell by about 2,500: about 2,000 because of the lower share of children (from 25% to 21% of the population) and about 600 because of the smaller population. In El Cóndor they rose by about 1,900: the population effect added about 2,900 and the share effect subtracted about 1,000. In Pampa de Huenuleo, the population effect added about 3,300 and the share effect subtracted about 1,500. The share of children fell in every district except Lago Moreno, as expected with fewer births. What sets the edges apart is the arrival of people. Within Urbana, the older social-housing neighbourhoods lost up to 58% of their children.
In 71 of the 73 neighbourhoods with enough children to measure it, the cohort aged 0–4 is smaller than the one aged 5–9 (median: 7 children aged 0–4 for every 10 aged 5–9). Because of births alone, no neighbourhood will need more primary places; only those that receive new residents.
The centre concentrates tourism and schools
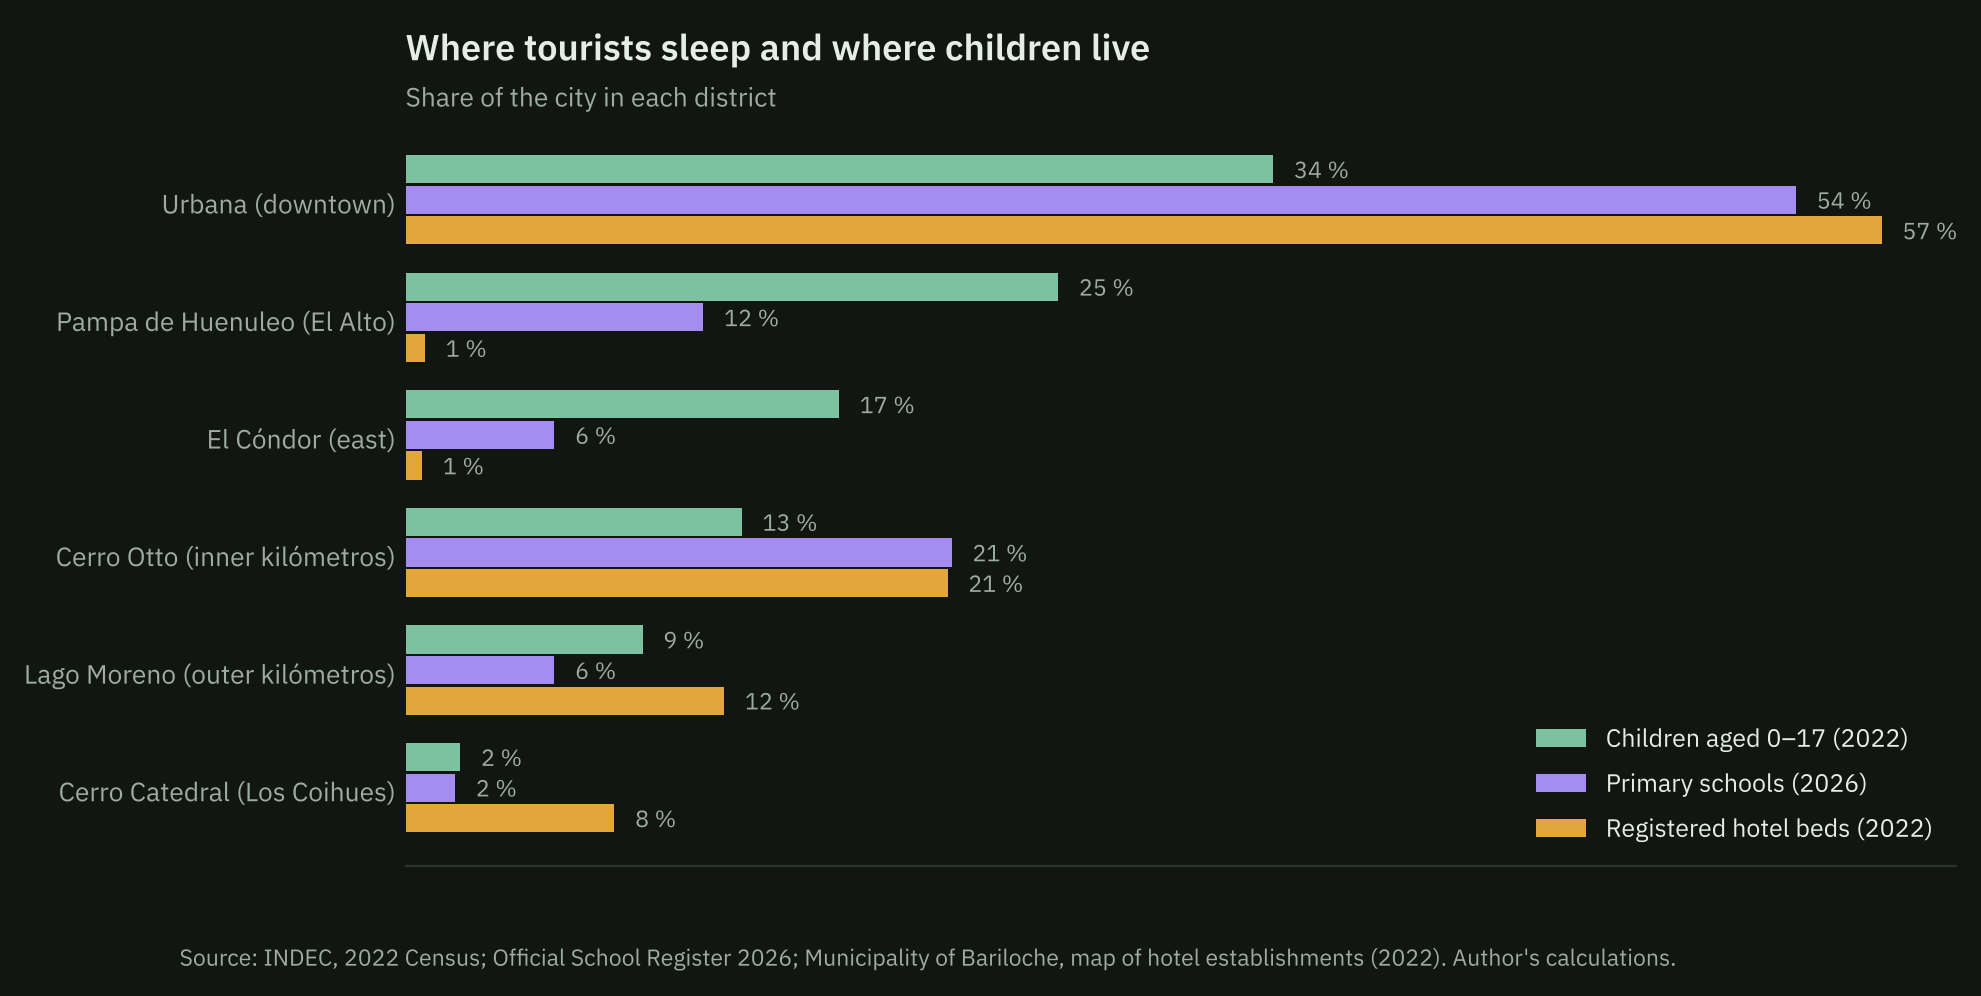
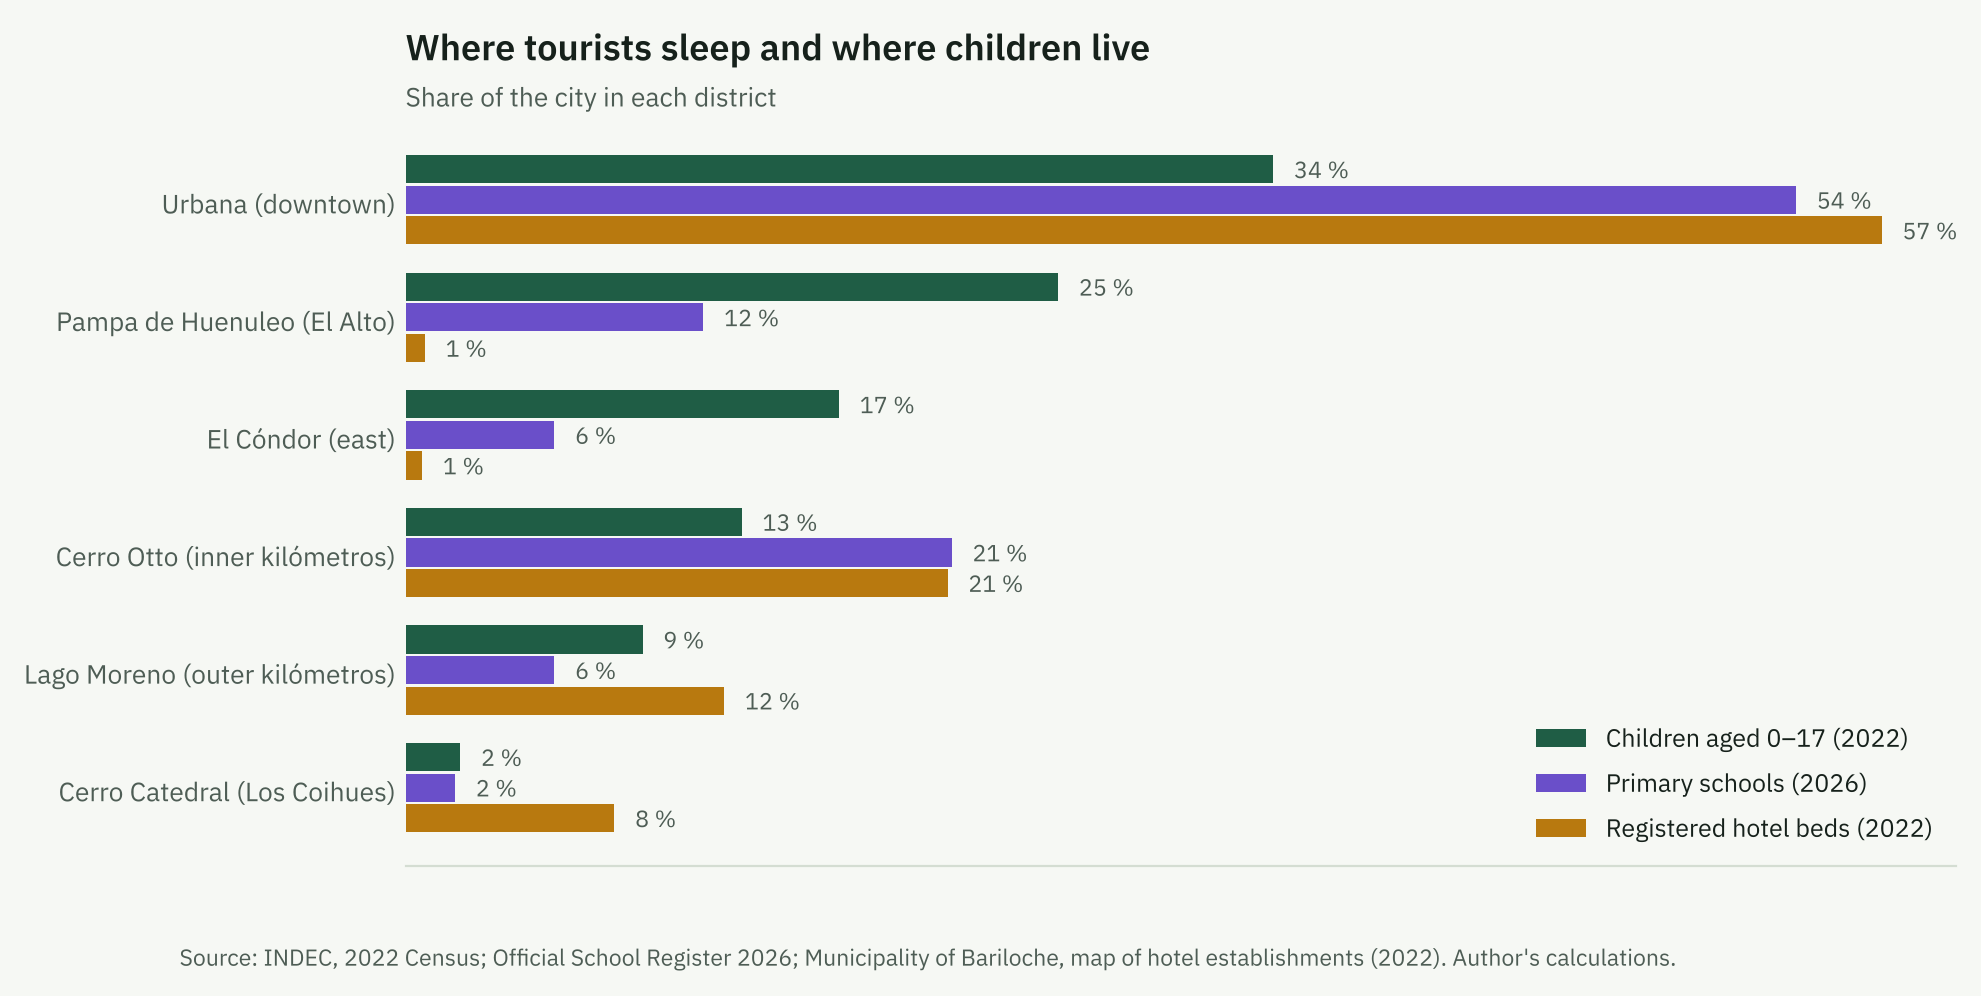
The Urbana district has 34% of children aged 0–17, 54% of primary schools and 57% of the 26,000 registered hotel beds: about 28 per 100 inhabitants, against 0.8 in El Cóndor and 0.7 in Pampa de Huenuleo. El Cóndor and Pampa de Huenuleo together have 42% of children, 17% of primary schools and 1% of hotel beds. The 2022 census found nobody present in 12% of Urbana’s dwellings, against 5% in El Cóndor and 5% in Pampa de Huenuleo. The hotel register excludes informal short-term rentals, so it understates tourist use of the centre.
Supply did not follow population
| District | Children 0–17 (2022) | Kindergartens | Primary | Secondary | Children 3–5 per kindergarten | Children 6–12 per primary | Children 13–17 per secondary | Population 2022–2035 (municipality) |
|---|---|---|---|---|---|---|---|---|
| El Cóndor | 5,600 | 1 | 3 | 3 | 877 | 811 | 552 | +71% |
| Pampa de Huenuleo | 8,400 | 7 | 6 | 4 | 196 | 619 | 585 | +44% |
| Lago Moreno | 3,100 | 3 | 3 | 0 | 156 | 456 | no school | +36% |
| Cerro Catedral | 700 | 1 | 1 | 0 | 107 | 324 | no school | +159% |
| Cerro Otto | 4,300 | 12 | 11 | 10 | 55 | 168 | 130 | +24% |
| Urbana | 11,200 | 26 | 28 | 21 | 72 | 164 | 159 | +13% |
Children: 2022 census interpolated to districts. Schools: located mainstream units, 2026. «No school»: there is no unit of that level within the district (children may attend one elsewhere).
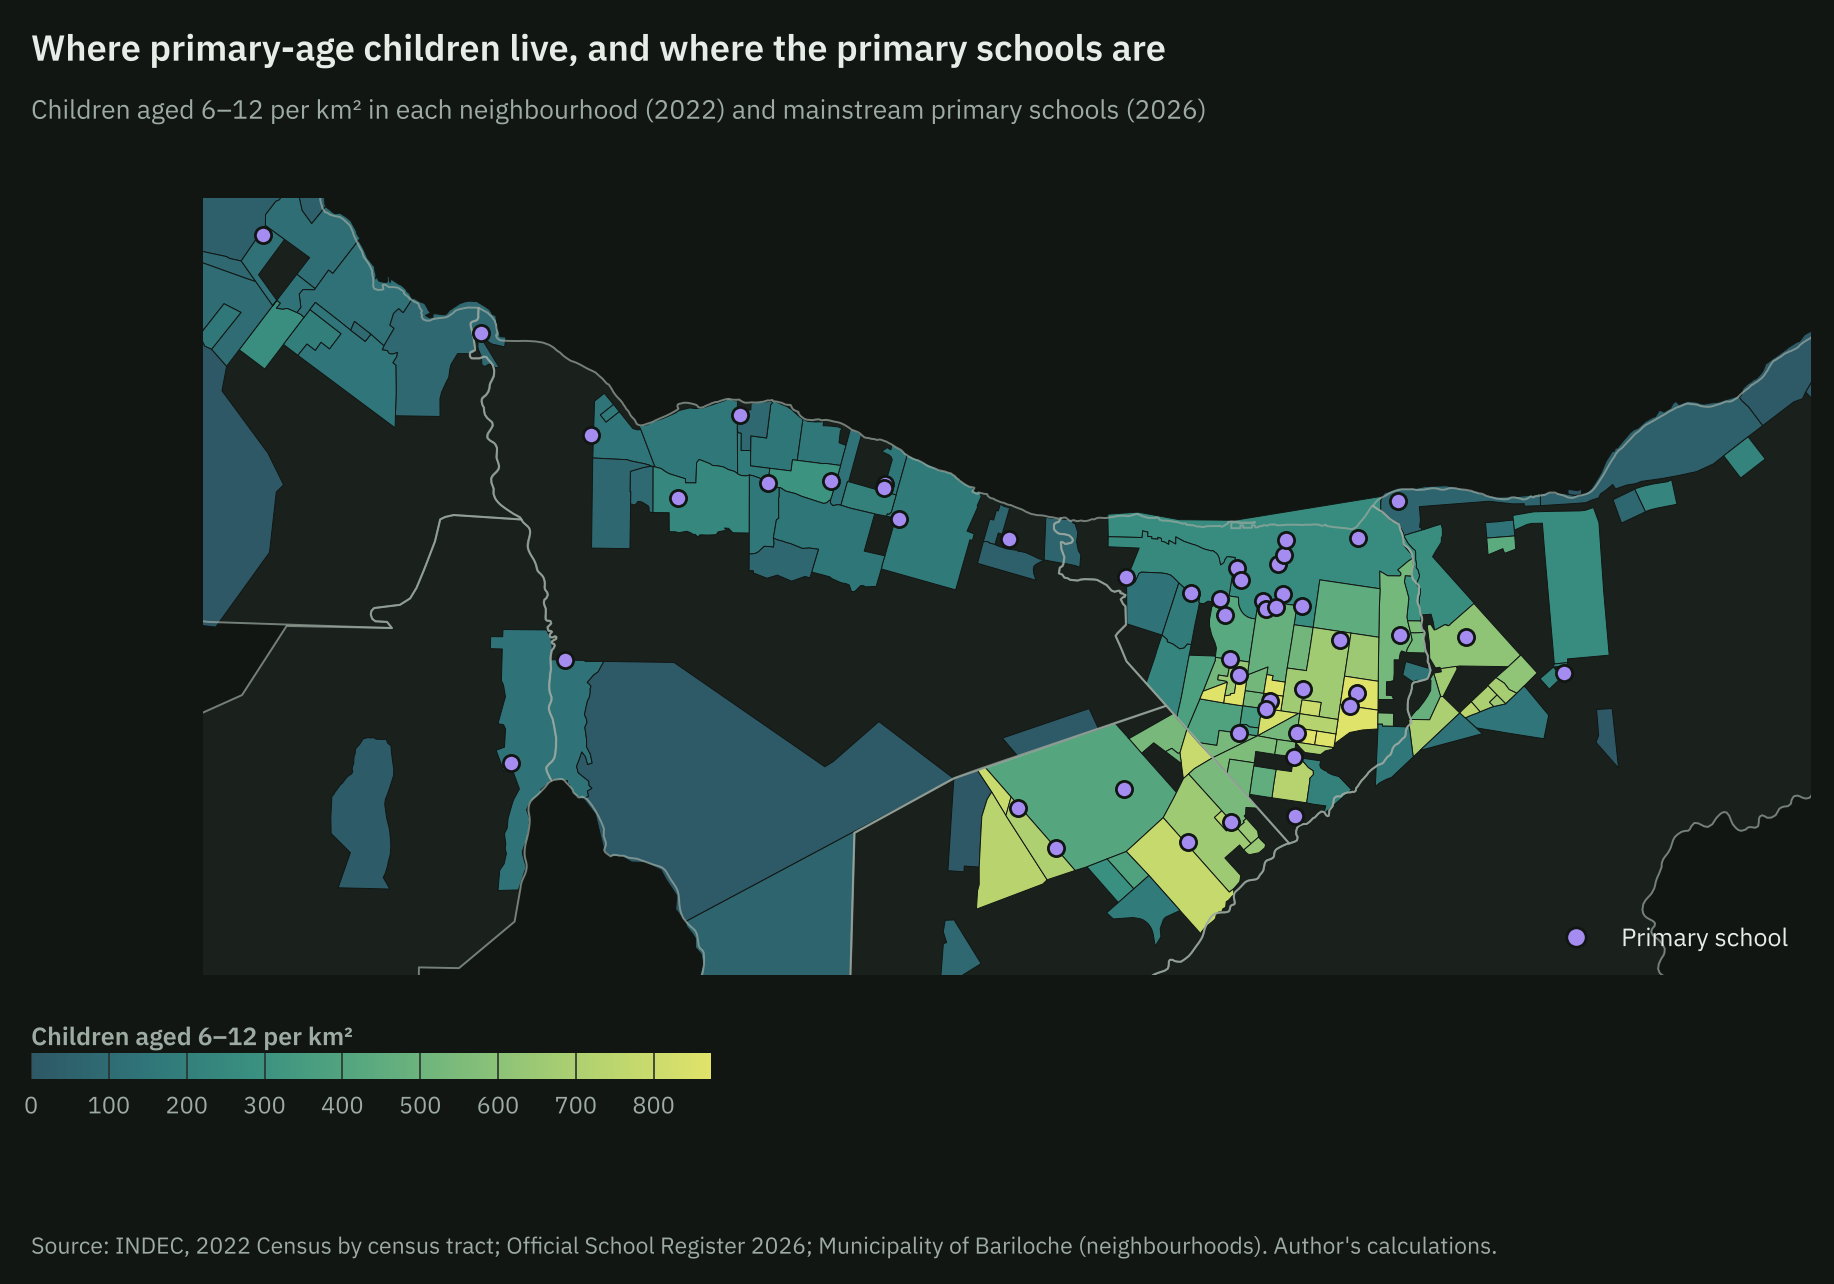
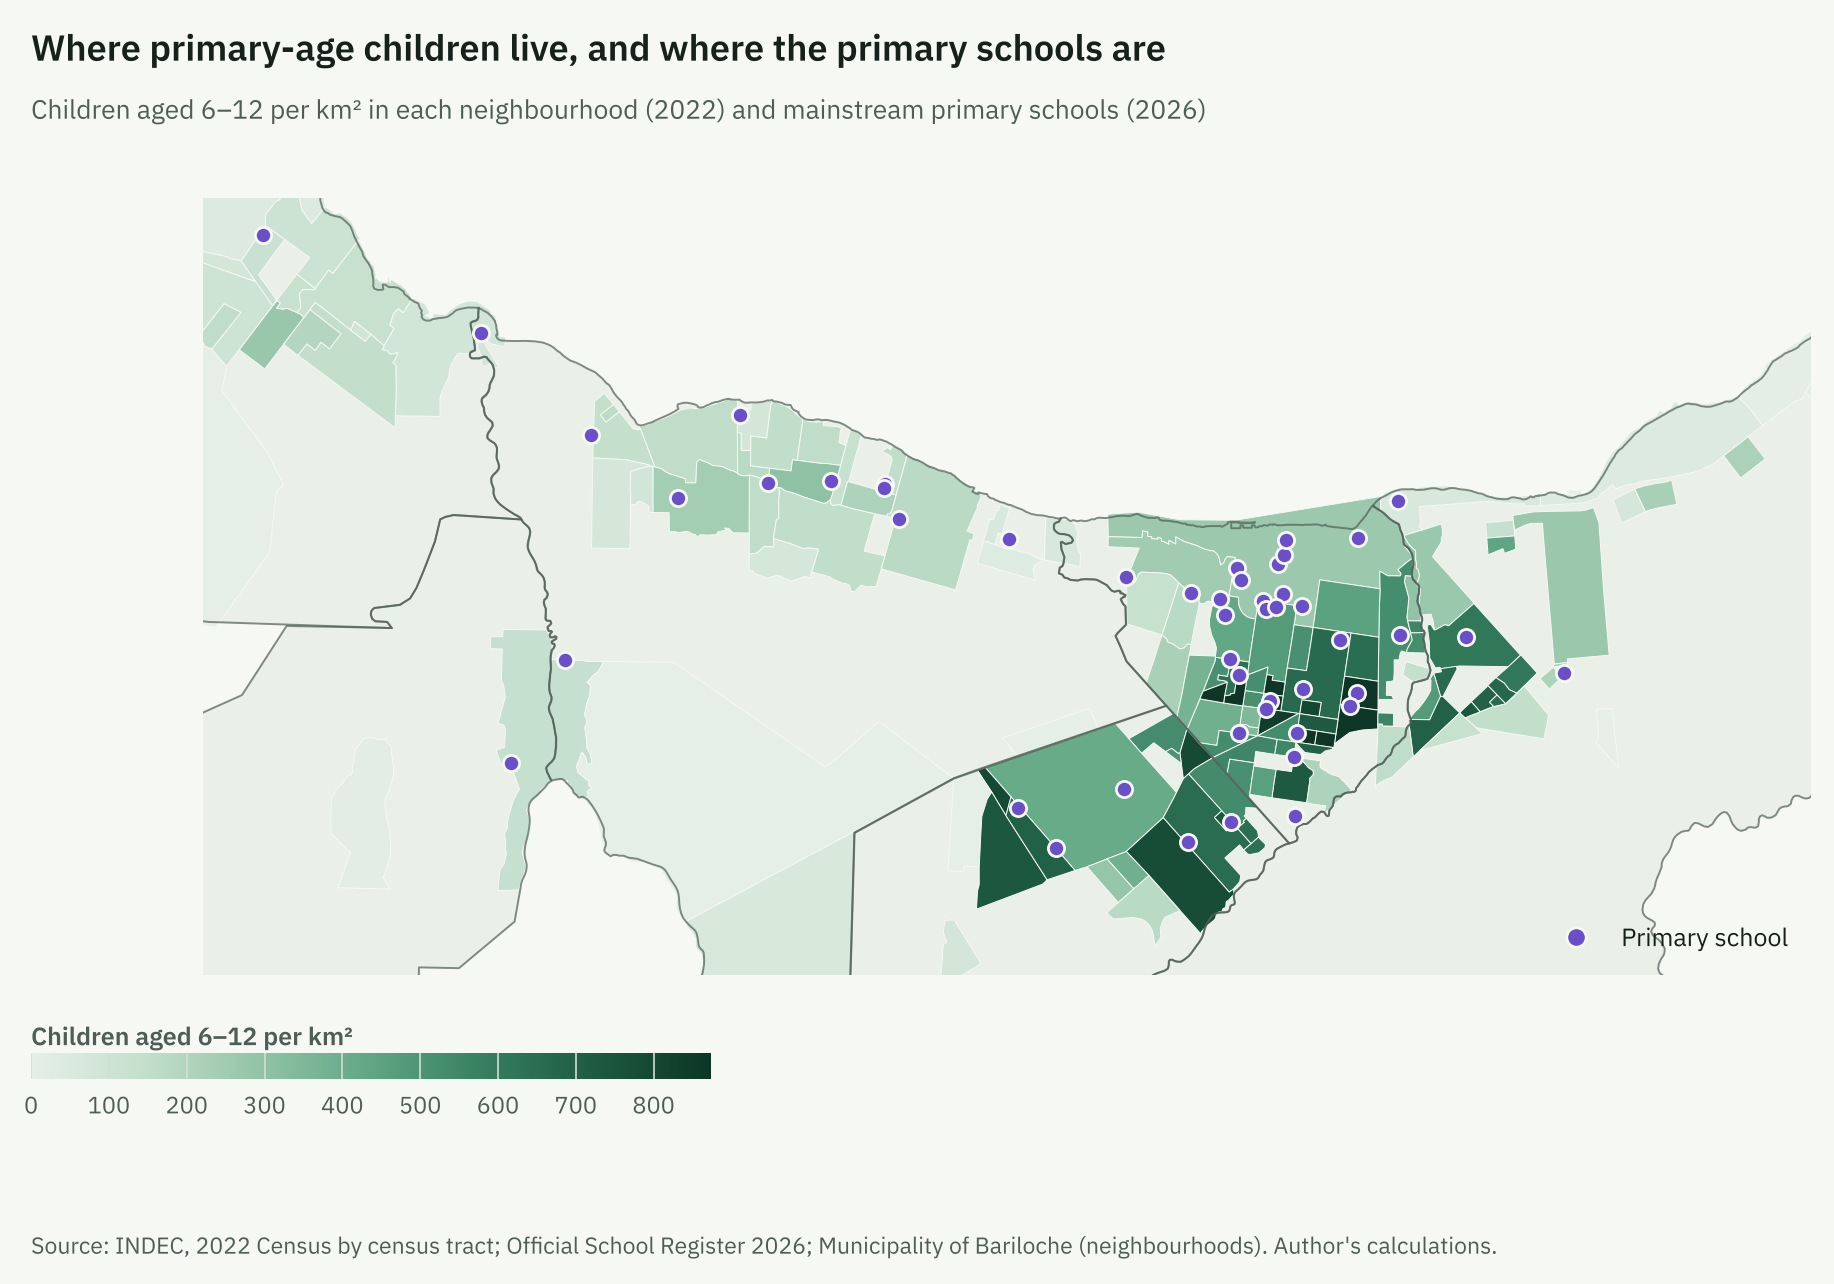
At primary level, the ratio of children to schools is 5 times higher in El Cóndor than in Urbana, and the gap is larger for kindergarten. Large neighbourhoods have no primary school within their limits: Nahuel Hue (about 640 children aged 6–12), 645 Viviendas (500) and Las Victorias (360). El Frutillar has about 1,020 children of that age and 2 primary schools.
The average distance to the nearest primary school is 0.7 km, but about 1,400 of the 14,400 children aged 6–12 (10%) live more than 1.5 km away. For kindergarten it is about 500 of 5,400 (10%); for secondary, about 1,000 of 9,800 live more than 3 km away (10%). Bus coverage is not the main bottleneck in the south: in Pampa de Huenuleo and El Cóndor the large majority of children live within 500 metres of a stop. It is in the west: 31% of children aged 6–17 in Lago Moreno and 23% in Cerro Otto live farther away (8% citywide). The south’s problem is distance and route: reaching central schools means using the same avenues that jam at rush hour.
The 2035 projection widens the gap
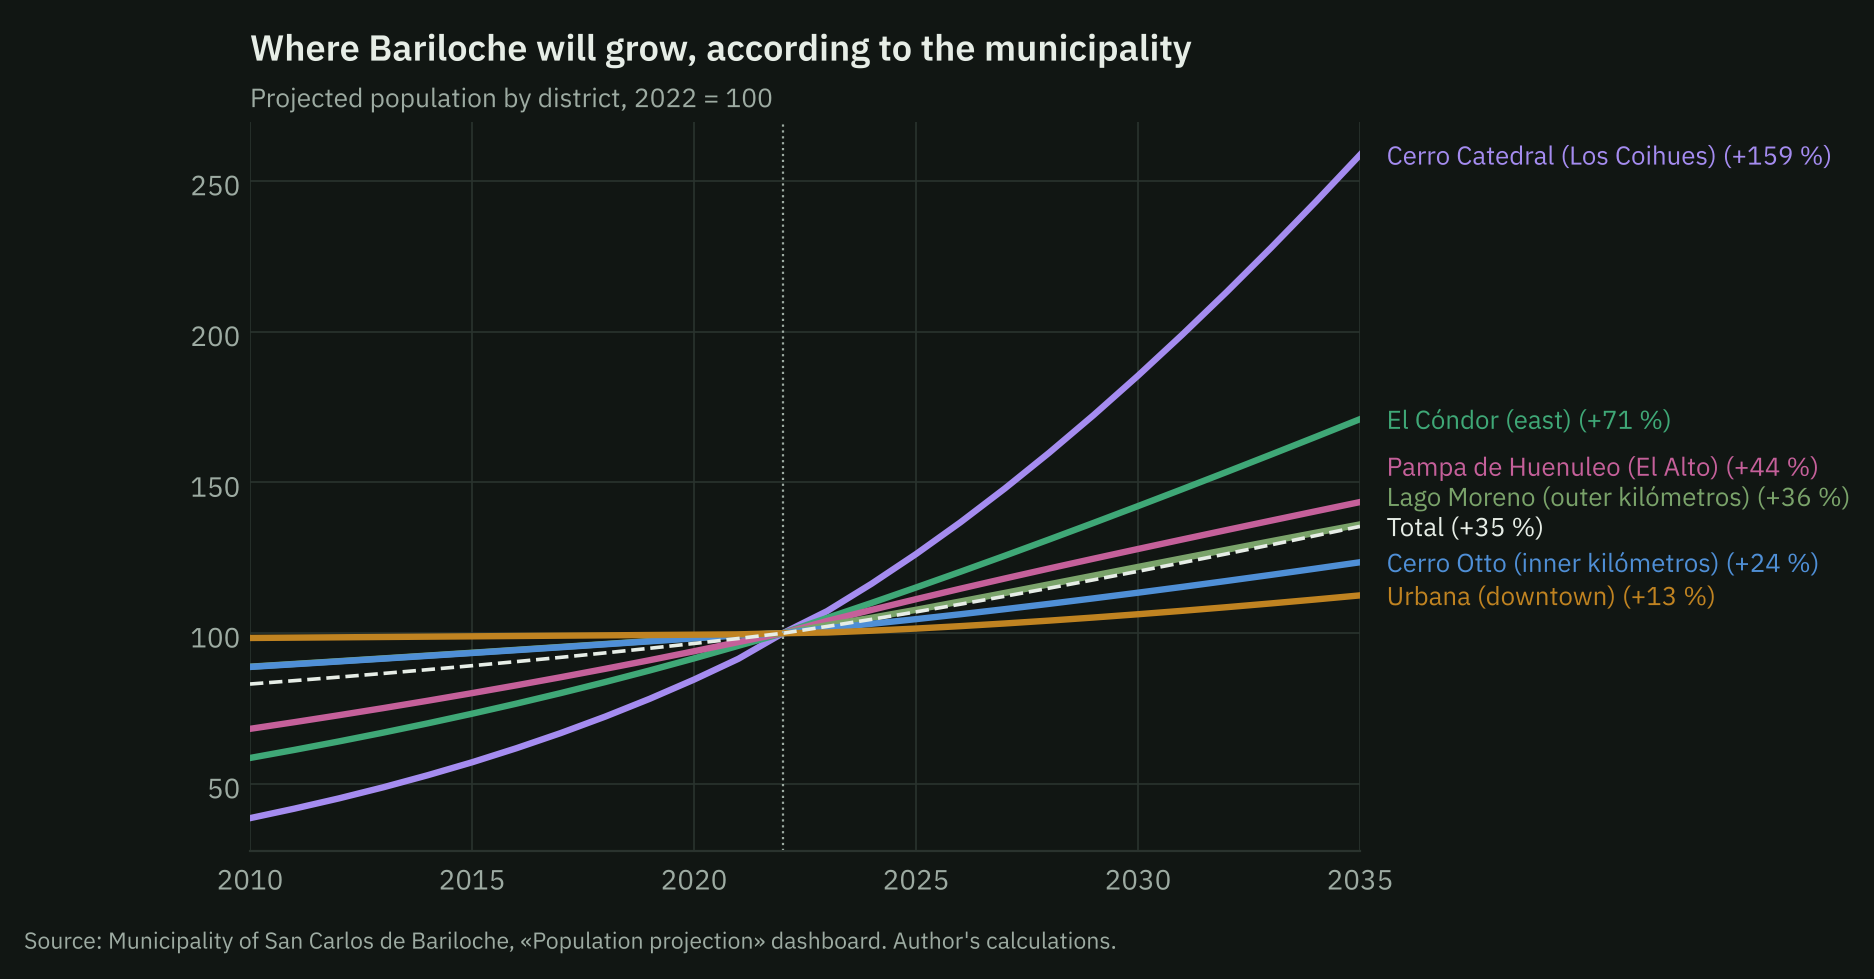
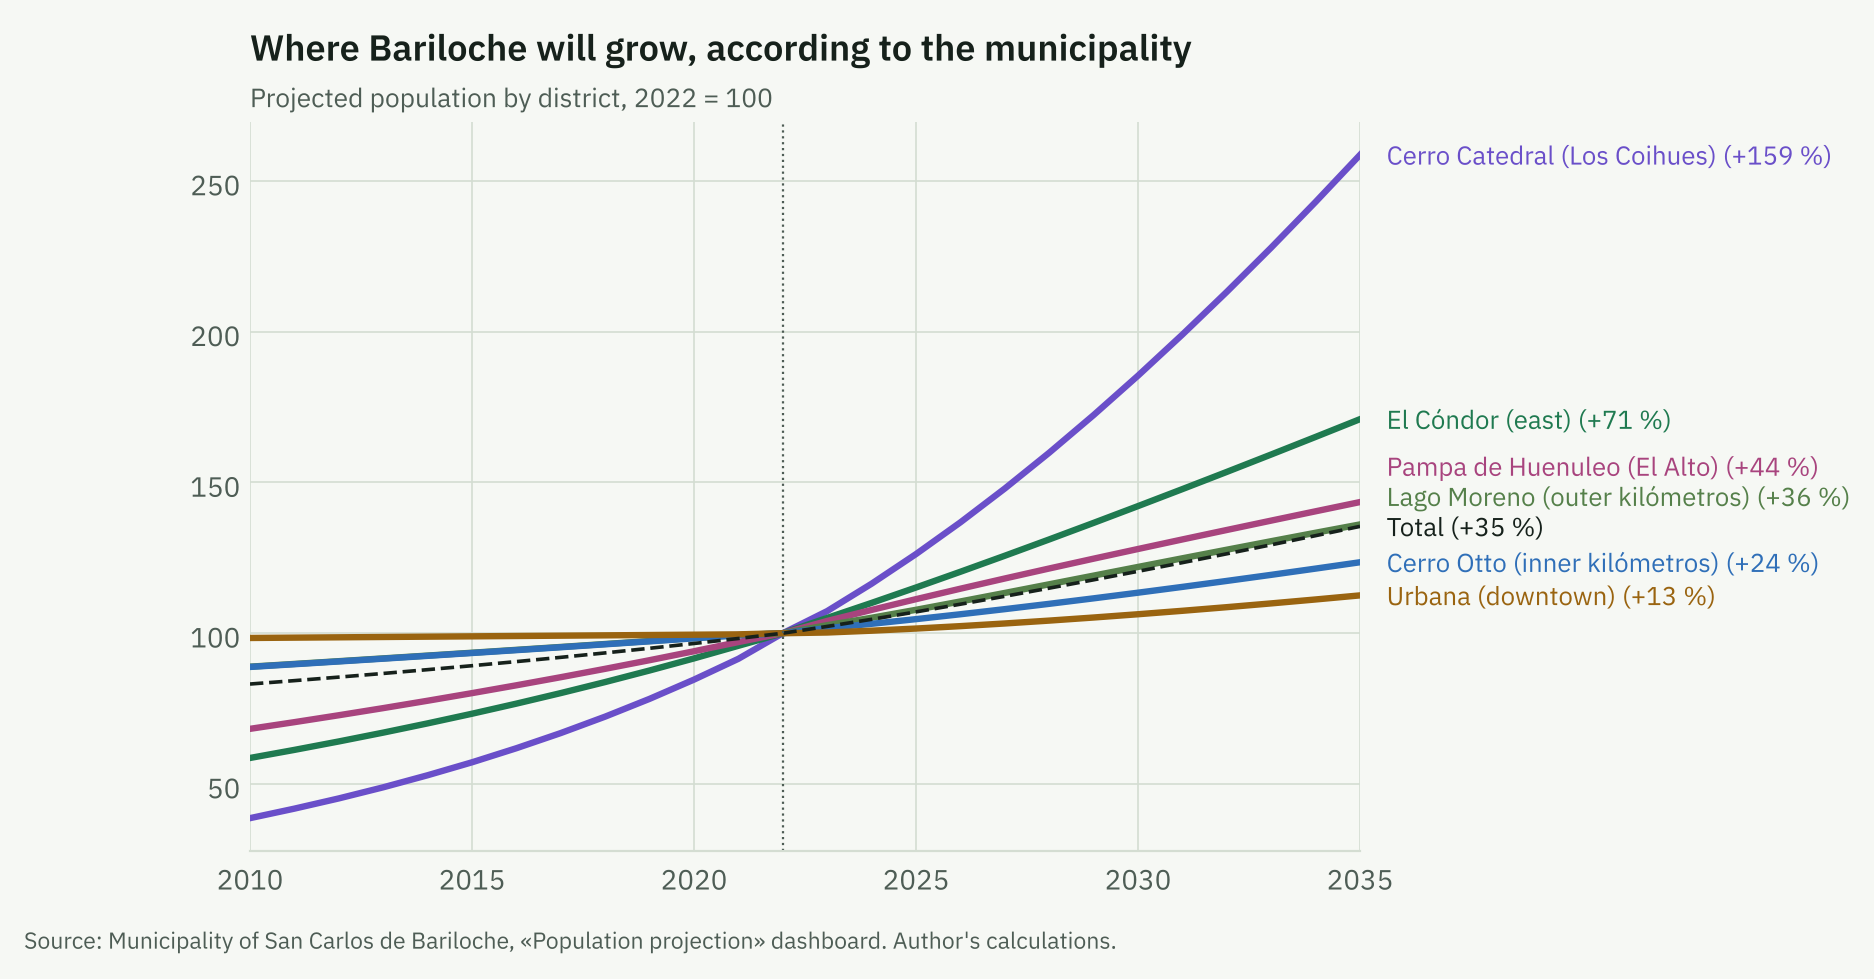
The municipality projects the city to grow from 135,775 inhabitants in 2022 to 183,891 in 2035 (35%), with 84% of the increase outside Urbana: El Cóndor +71%, Pampa de Huenuleo +44% and Cerro Catedral +159%.
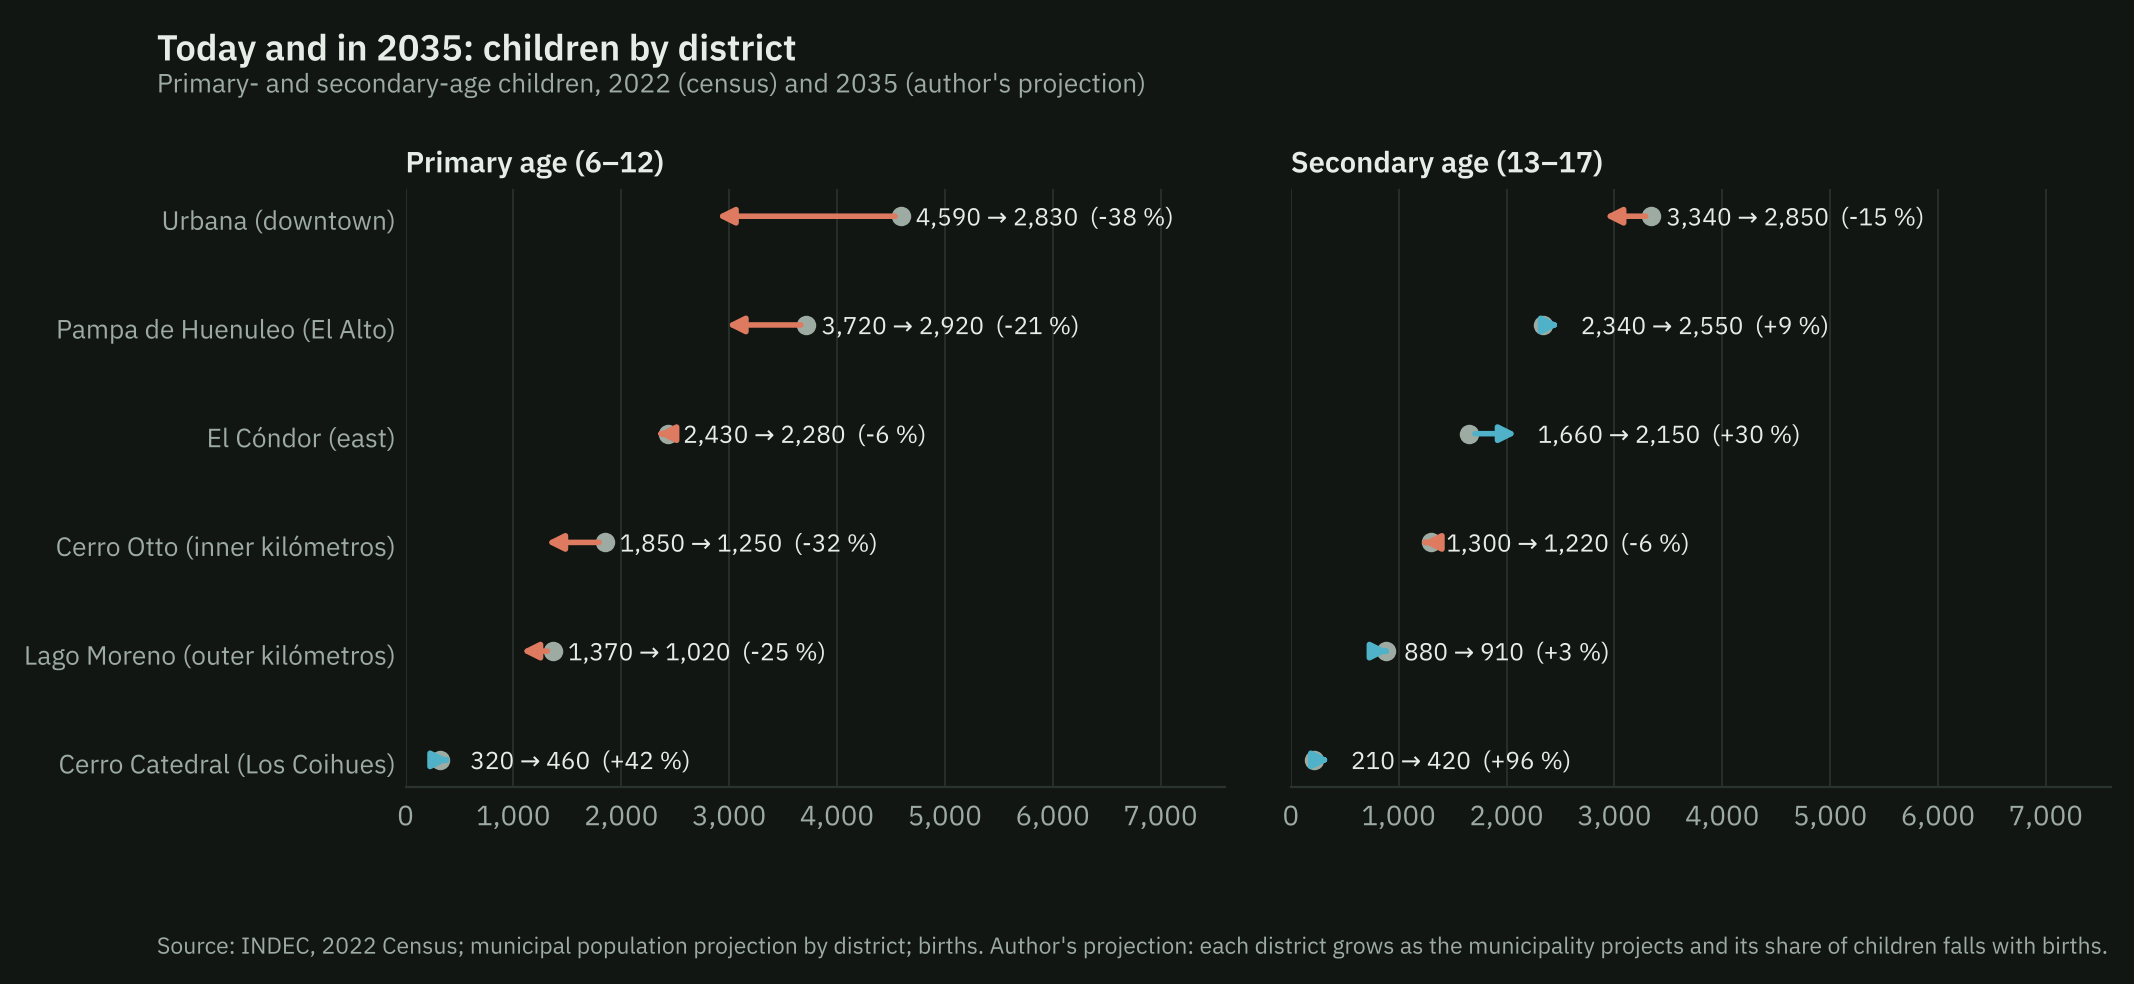
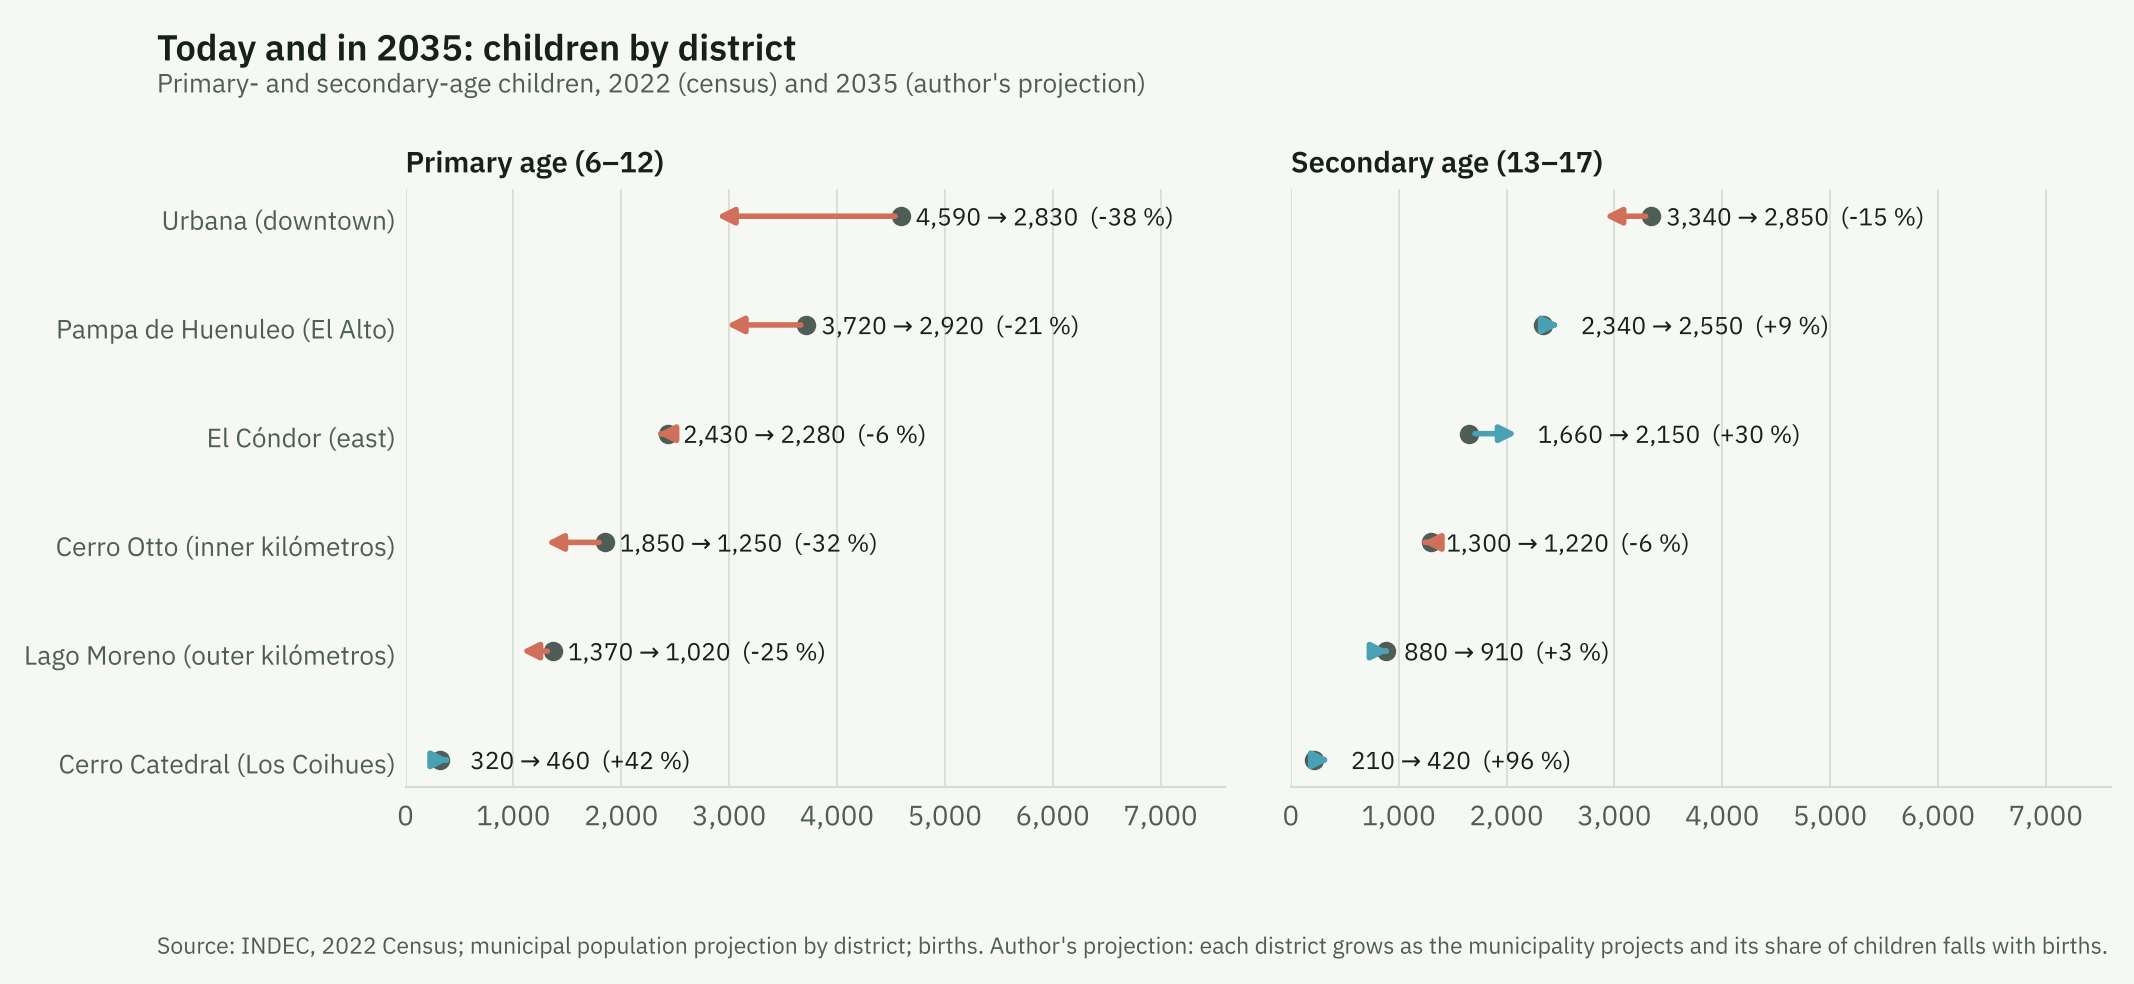
| District | 6–12 (2022) | 6–12 (2035) | Change | 13–17 (2022) | 13–17 (2035) | Change | Primary schools (2026) | Per school, 2022 → 2035 |
|---|---|---|---|---|---|---|---|---|
| Cerro Catedral (Los Coihues) | 320 | 460 | +42 % | 210 | 420 | +96 % | 1 | 324 → 460 |
| El Cóndor (east) | 2,430 | 2,280 | −6 % | 1,660 | 2,150 | +30 % | 3 | 811 → 760 |
| Pampa de Huenuleo (El Alto) | 3,720 | 2,920 | −21 % | 2,340 | 2,550 | +9 % | 6 | 619 → 487 |
| Lago Moreno (outer kilómetros) | 1,370 | 1,020 | −25 % | 880 | 910 | +3 % | 3 | 456 → 340 |
| Cerro Otto (inner kilómetros) | 1,850 | 1,250 | −32 % | 1,300 | 1,220 | −6 % | 11 | 168 → 114 |
| Urbana (downtown) | 4,590 | 2,830 | −38 % | 3,340 | 2,850 | −15 % | 28 | 164 → 101 |
| Total | 14,280 | 10,770 | −25 % | 9,740 | 10,100 | +4 % |
Author’s projection (see Methods). Primary schools: mainstream units in 2026; the last column assumes no new schools.
Combining both projections, the city’s population aged 6–12 would fall by 25% between 2022 and 2035 and the population aged 13–17 would rise by 4%. But the distribution is very uneven. In Urbana, primary-age children would fall by 38% and secondary-age ones by 15%. In El Cóndor, primary-age children would fall by only 6% and secondary-age ones would rise by 30%; in Cerro Catedral, which has no secondary school, they would rise by 96%. Without new schools, children per primary school would go from 811 to 760 in El Cóndor and from 164 to 101 in Urbana: the gap, now 5 to one, would be 7.5 to one. At secondary level, El Cóndor would have about 716 adolescents per school and Urbana 136.
Explore
How to use it. At the top, choose what to show: neighbourhoods or districts, and the indicator that colours the map (for example, the change in children between 2010 and 2022, or how many children aged 6–12 there are per primary school). Each dot is a mainstream school building; when a building hosts kindergarten, primary or secondary, the dot carries the colour of each level, and the «Schools» buttons let you keep only one. Click a neighbourhood, a district or a school to see its numbers and the list of schools on the right. «Highlight neighbourhoods» marks, for example, the neighbourhoods without their own primary school. The mouse wheel (or two fingers on a phone) zooms in down to street level; «No colour» leaves just the street map.
Discussion
The data describe a city with two problems pulling in opposite directions. In aggregate, primary demand is already falling and secondary demand will fall after 2029. Spatially, demand concentrates at the edges, where supply is scarce and where the municipal projection places almost all future growth, while the centre concentrates schools, tourism and a population with ever fewer children.
There are three implications for planning. First, falling births will not solve the shortage at the edges: even with smaller cohorts, a district growing like El Cóndor (+71%) will need more places, especially in secondary. Second, the centre will probably have small classes, as is already happening in Buenos Aires; this opens room to extend the school day, open classes for three-year-olds or support students who fall behind, if the resources are not lost. Third, where schools are is also a mobility policy: each class opened close to where children live is one trip fewer along the trunk avenues at rush hour, and bus routes and timetables can be planned together with the school map.
Limitations
- We do not observe enrolment. Everything we call supply is units. We do not know how many pupils or classes each school has. The public school-level database of the Annual Survey is anonymised.1
- Children do not necessarily attend the nearest school. There are private schools, school choice and parents’ work. Ratios by area describe nearby supply, not where each child studies.
- Areal interpolation assumes even population within each tract. In the large tracts at the edges the error can be important.
- Distances are straight lines, without slopes, lakes or road network.
- The municipal projection has no published method, and our projection of children inherits its assumptions and adds its own (newcomers with the same age structure as residents; constant births from 2026).
- The department is not the city. Births are by department; the census check suggests the city is a stable share.
- The hotel register dates from 2022 and excludes informal short-term rentals.
Next steps
- Enrolment by school, once the request is answered: pupils per class and occupancy by area.
- Level attended by tract (2022 census), to measure demand by level actually attended and not only by age.
- Building permits and subdivisions: allocate new floor area to areas to anticipate where families will settle.
- Tourist accommodation: match the municipal register with platform listings to measure tourist use of the central housing stock.
Sources
- RENAPER, «Nacimientos por departamento y año 2012–2022», datos.gob.ar.
- Río Negro Ministry of Health, Provincial Statistics Office, Estadísticas Vitales 2020 and 2022–2025.
- Río Negro Civil Registry, press releases on registered births, January–September 2026.
- INDEC, National Population, Household and Housing Censuses 1991, 2010 and 2022, by census tract (processing with CONICET cartography, Rodríguez and de Grande, on source.coop).
- Ministry of Human Capital, Padrón Oficial de Establecimientos Educativos, 2011–2026 editions.
- Municipality of San Carlos de Bariloche: zoning map (neighbourhoods and districts), map of schools, «Proyección Población» dashboard, «Mapa de establecimientos hoteleros de la ciudad» dashboard (2022) and map of the urban bus system.
- Georef geographic data normalisation service, datos.gob.ar.
- Falch, T., Lujala, P. and Strøm, B. (2013). «Geographical constraints and educational attainment». Regional Science and Urban Economics, 43(1), 164–176.
- K-12 Dive, «Study: Using public transit for school commute linked to higher absenteeism», 20/3/2019 (Johns Hopkins University study on Baltimore).
- De Simone, M., Alzú, M. S. and Nistal, M., «Presente y futuro de la cantidad de alumnos por docente y por grado», Observatorio Argentinos por la Educación, 2026 (reviewed by Chequeado).
- Infobae, «Baja de natalidad y educación: las escuelas porteñas cierran grados…», 15/10/2025.
- ANBariloche, «Zona centro y avenidas colapsadas en horas pico», 12/7/2024.